MATLAB: An Introduction with Applications
6th Edition
ISBN: 9781119256830
Author: Amos Gilat
Publisher: John Wiley & Sons Inc
expand_more
expand_more
format_list_bulleted
Question

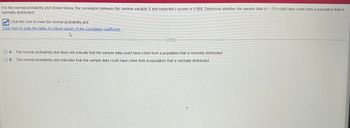
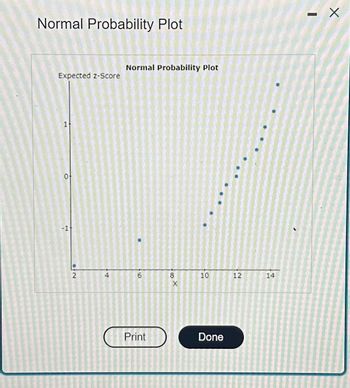
Transcribed Image Text:For the normal probability plot shown below, the correlation between the random variable X and expected z-scores is 0.889. Determine whether the sample data (n= 15) could have come from a population that is
normally distributed.
Click the icon to view the normal probability plot.
Click here to view the table of critical values of the correlation coefficient.
OA. The normal probability plot does not indicate that the sample data could have come from a population that is normally distributed
OB. The normal probability plot indicates that the sample data could have come from a population that is normally distributed

Transcribed Image Text:Normal Probability Plot
12
Expected z-Score
1
0
-1
2
Normal Probability Plot
- 10
6
Print
100 x
8
X
10
Done
51
12
14
X
Expert Solution
This question has been solved!
Explore an expertly crafted, step-by-step solution for a thorough understanding of key concepts.
Step by stepSolved in 3 steps with 1 images

Knowledge Booster
Similar questions
- For the normal probability plot shown below, the correlation between the random variable X and expected z-scores is 0.889. Determine whether the sample data (n = 15) could have come from a population that is normally distributed Click the icon to view the normal probability plot. Click here to view the table of critical values of the correlation coefficient. OA. The normal probability plot indicates that the sample data could have come from a population that is normally distributed B. The normal probability plot does not indicate that the sample data could have come from a population that is normally distributedarrow_forwardRefer to the accompanying table, which describes results from groups of 8 births from 8 different sets of parents. The random variable x represents the number of girls among 8 children. Find the mean and standard deviation for the number of girls in 8 births. Click the icon to view the data table. The mean is u= girl(s). (Round to one decimal place as needed.) The standard deviation is o = e# girl(s). (Round to one decimal place as needed.) Table of numbers of girls and probabilities Number of Girls x 0 1 2 3 4 5 6 7 8 átv P(x) 0.004 0.034 0.117 0.218 0.278 0.217 0.102 0.027 0.003 D - X NiZ Nextarrow_forwardRefer to the accompanying table, which describes results from groups of 8 births from 8 different sets of parents. The random variable x represents the number of girls among 8 children. Find the mean and standard deviation for the number of girls in 8 births. Click the icon to view the data table. The mean is u = girl(s). (Round to one decimal place as needed.) The standard deviation is o = girl(s). (Round to one decimal place as needed.)arrow_forward
- A certain prescription medicine is supposed to contain an average of 250 parts per million (ppm) of a certain chemical. If the concentration is higher than this, the drug may cause harmful side effects; if it is lower, the drug may be ineffective. The manufacturer runs a check to see if the mean concentration in a large shipment conforms to the target level of 250 ppm or not. A simple random sample of 100 portions is tested, and the sample mean concentration is found to be 247 ppm. The sample concentration standard deviation is s = 12 ppm. What are the appropriate null and alternative hypotheses? Group of answer choices H 0: x̄ = 250 vs. H a: x̄ < 250 H 0: x̄ = 250 vs. H a: x̄ ≠ 250 H 0: x̄ = 250 vs. H a: x̄ > 250 H 0: μ = 250 vs. H a:μ < 250 H 0: μ = 250 vs. H a: μ ≠ 250 H 0: μ = 250 vs. H a: μ > 250arrow_forwardAn analyst found that the average amount of money in bank accounts at his/her bank is $2,000 with a standard deviation of $150. What would be the variance?arrow_forwardThe average number of pounds of red meat a person consumes each year is 196 with a standard deviation of 22 pounds (Source: American Dietetic Association). If a sample of 50 individuals is randomly selected, find the probability that the mean of the sample will be greater than 200 pounds. OA. 0.0985 OB. 0.9015 OC. 0.8815 O D. 0.7613 Carrow_forward
- A study found that there was 48% chance that the driver fails a breathalyzer test when it is administered on a Friday night. The test is administered to 80 drivers. What distribution that can be used to model the above situation. How many drivers do we expect to fail the testarrow_forwardA successful basketball player has a height of 6 feet 11 inches, or 211 cm. Based on statistics from a data set, his height converts to the z score of 5.17. How many standard deviations is his height above the mean?arrow_forwardDan is doing research on organic farming for an agricultural foundation. He has collected data on the number of oranges harvested from individual trees in two different orchards. In each orchard, the number of oranges harvested from each of 57 trees was recorded. The histograms below show the distributions of the two data sets. The means and standard deviations for the data sets are also given. Orchard 1 Orchard 2 25 25 20- 20- 15+ 15- 10+ 10+ 5+ 5+ 199.5 219.5 239.5 259.5 279.5 299.5 319.5 339.5 359.5 199.5 219.5 239.5 259.5 279.5 299.5 319.5 339.5 359.5 Orchard 1 mean: 275.1 oranges Orchard 2 mean: 274.9 oranges Orchard 1 standard deviation: 23.2 oranges Orchard 2 standard deviation: 47.9 oranges Dan wants to use the Empirical Rule to make some approximations about both data sets. Unfortunately, it is appropriate to use the Empirical Rule on only one of them! Answer the parts below to help Dan with his approximations. (a) Identify the data set for which it is appropriate to use the…arrow_forward
arrow_back_ios
arrow_forward_ios
Recommended textbooks for you
 MATLAB: An Introduction with ApplicationsStatisticsISBN:9781119256830Author:Amos GilatPublisher:John Wiley & Sons Inc
 Probability and Statistics for Engineering and th...StatisticsISBN:9781305251809Author:Jay L. DevorePublisher:Cengage Learning
 Statistics for The Behavioral Sciences (MindTap C...StatisticsISBN:9781305504912Author:Frederick J Gravetter, Larry B. WallnauPublisher:Cengage Learning
 Elementary Statistics: Picturing the World (7th E...StatisticsISBN:9780134683416Author:Ron Larson, Betsy FarberPublisher:PEARSON
 The Basic Practice of StatisticsStatisticsISBN:9781319042578Author:David S. Moore, William I. Notz, Michael A. FlignerPublisher:W. H. Freeman
 Introduction to the Practice of StatisticsStatisticsISBN:9781319013387Author:David S. Moore, George P. McCabe, Bruce A. CraigPublisher:W. H. Freeman

MATLAB: An Introduction with Applications
Statistics
ISBN:9781119256830
Author:Amos Gilat
Publisher:John Wiley & Sons Inc

Probability and Statistics for Engineering and th...
Statistics
ISBN:9781305251809
Author:Jay L. Devore
Publisher:Cengage Learning

Statistics for The Behavioral Sciences (MindTap C...
Statistics
ISBN:9781305504912
Author:Frederick J Gravetter, Larry B. Wallnau
Publisher:Cengage Learning

Elementary Statistics: Picturing the World (7th E...
Statistics
ISBN:9780134683416
Author:Ron Larson, Betsy Farber
Publisher:PEARSON

The Basic Practice of Statistics
Statistics
ISBN:9781319042578
Author:David S. Moore, William I. Notz, Michael A. Fligner
Publisher:W. H. Freeman

Introduction to the Practice of Statistics
Statistics
ISBN:9781319013387
Author:David S. Moore, George P. McCabe, Bruce A. Craig
Publisher:W. H. Freeman