
MATLAB: An Introduction with Applications
6th Edition
ISBN: 9781119256830
Author: Amos Gilat
Publisher: John Wiley & Sons Inc
expand_more
expand_more
format_list_bulleted
Related questions
Question

Transcribed Image Text:K
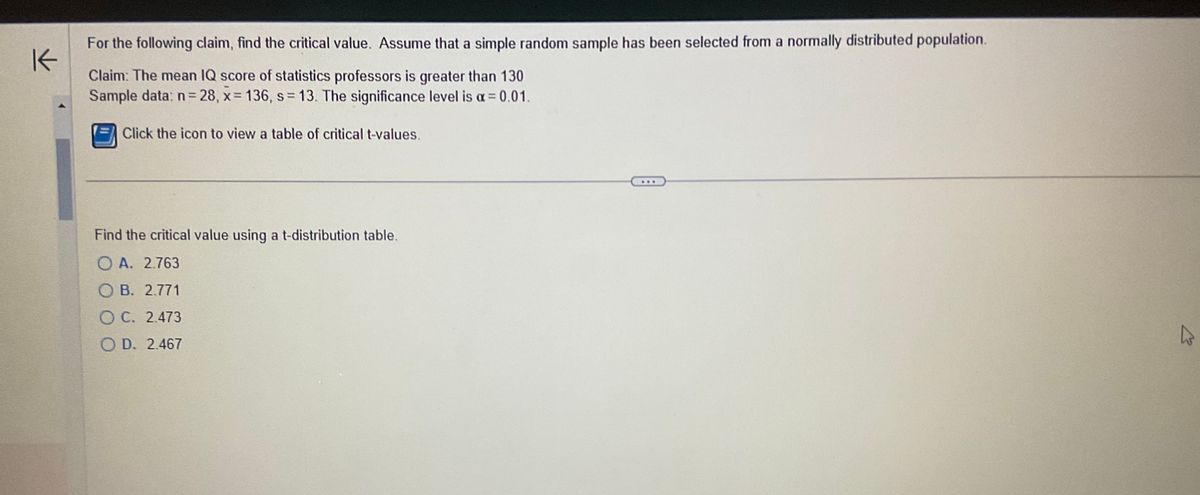
For the following claim, find the critical value. Assume that a simple random sample has been selected from a normally distributed population.
Claim: The mean IQ score of statistics professors is greater than 130
Sample data: n=28, x= 136, s = 13. The significance level is a = 0.01.
Click the icon to view a table of critical t-values.
Find the critical value using a t-distribution table.
OA. 2.763
O B. 2.771
OC. 2.473
OD. 2.467
...
W
Expert Solution
This question has been solved!
Explore an expertly crafted, step-by-step solution for a thorough understanding of key concepts.

This is a popular solution

Trending nowThis is a popular solution!

Step by stepSolved in 2 steps

Knowledge Booster

Similar questions
- In this problem, assume that the distribution of differences is approximately normal. Note: For degrees of freedom d.f. not in the Student's t table, use the closest d.f. that is smaller. In some situations, this choice of d.f. may increase the P-value by a small amount and therefore produce a slightly more "conservative" answer. In the following data pairs, A represents the cost of living index for utilities and B represents the cost of living index for transportation. The data are paired by metropolitan areas in the United States. A random sample of 46 metropolitan areas gave the following information. Do the data indicate that the U.S. population mean cost of living index for utilities is less than that for transportation in these areas? Use α = 0.05. (Let d = A − B.) (a) What is the level of significance? (b)What is the value of the sample test statistic? (Round your answer to three decimal places.)arrow_forwardq3- For categorical data: Select one or more: a. We can't apply boxplot to show its distribution b. We can apply aggregate functions. c. We can't use histogram to show its distribution. d. The interval between units is the same.arrow_forwardThe accompanying data represent the miles per gallon of a random sample of cars with a three cylinder 1.0 liter enginearrow_forward
- Refer to the data set in the accompanying table. Assume that the paired sample data is a simple random sample and the differences have a distribution that is approximately normal. Use a significance level of 0.05 to test for a difference between the weights of discarded paper (in pounds) and weights of discarded plastic (in pounds). E Click the icon to view the data. In this example, Hg is the mean value of the differences d for the population of all pairs of data, where each individual difference d is defined as the weight of discarded paper minus the weight of discarded plastic for a household. What are the null and alternative hypotheses for the hypothesis test? O A. Ho: Ha = 0 H,: Ha #0 O B. Ho: Ha #0 H1: Hd =0 O C. Ho: Ha #0 O D. Ho: Ha = 0 H1: Hd 0arrow_forwardConsider the data from the Anthropology 105 class. The mean for women is 64.33 in and the standard deviation is 2.64 in. The average height of men in the US is approximately 5ft 10in. What proportion of women represented here are shorter than the average man?arrow_forwardAmong applicants to a school of public health, the average GRE writing score was about 3, the SD was about 0.5, and the lowest score was 2.5. True or False: the GRE writing scores follow the normal curve. Select one: True False Brevious page Next page Carrow_forward
- For the following scores from a sample: a. Compute the mean, median and mode for the scores. b. Compute the SS, variance and SD. X f 7 1 6 2 5 2 4 2 3 1 MacBook Airarrow_forwardRefer to the figure at the right. At a= 0.10, can you reject the claim that the proportion of 18 to 24-year-olds living in their parents' homes in 2000 was the same for men and women? Assume the survey included a random sample of 270 men and 278 women. Percentage of 18- to 24-year olds living in parents' homes 70, 60.4% 45% 54.6% 50.3% 2000 2012 Men Women Identify the null and alternative hypotheses. Choose the correct answer below. O B. Ho: P, * P2 Ha: P1 = P2 OD. Ho: P1 > P2 YA. Ho: P1 = P2 H3: P, * P2 OC. Ho: P, P2 Ha: P, SP2 Find the critical value(s). The critical value(s) is(are). (Round to two decimal places as needed. Use a comma to separate answers as needed.)arrow_forwardRefer to the data set in the accompanying table. Assume that the paired sample data is a simple random sample and the differences have a distribution that is approximately normal. Use a significance level of 0.05 to test for a difference between the weights of discarded paper (in pounds) and weights of discarded plastic (in pounds). LOADING... Click the icon to view the data. In this example, μd is the mean value of the differences d for the population of all pairs of data, where each individual difference d is defined as the weight of discarded paper minus the weight of discarded plastic for a household. What are the null and alternative hypotheses for the hypothesis test? A. H0: μd≠0 H1: μd>0 B. H0: μd=0 H1: μd<0 C. H0: μd=0 H1: μd≠0 D. H0: μd≠0 H1: μd=0 Household Paper Plastic 1 6.44 8.40 2 7.72 3.86 3 3.27 0.63 4 9.19 3.74 5 14.33 6.43 6 11.08 12.47 7…arrow_forward
arrow_back_ios
arrow_forward_ios
Recommended textbooks for you
- MATLAB: An Introduction with ApplicationsStatisticsISBN:9781119256830Author:Amos GilatPublisher:John Wiley & Sons Inc
 Probability and Statistics for Engineering and th...StatisticsISBN:9781305251809Author:Jay L. DevorePublisher:Cengage Learning
 Statistics for The Behavioral Sciences (MindTap C...StatisticsISBN:9781305504912Author:Frederick J Gravetter, Larry B. WallnauPublisher:Cengage Learning
  Elementary Statistics: Picturing the World (7th E...StatisticsISBN:9780134683416Author:Ron Larson, Betsy FarberPublisher:PEARSON
 The Basic Practice of StatisticsStatisticsISBN:9781319042578Author:David S. Moore, William I. Notz, Michael A. FlignerPublisher:W. H. Freeman
 Introduction to the Practice of StatisticsStatisticsISBN:9781319013387Author:David S. Moore, George P. McCabe, Bruce A. CraigPublisher:W. H. Freeman
MATLAB: An Introduction with Applications
Statistics
ISBN:9781119256830
Author:Amos Gilat
Publisher:John Wiley & Sons Inc
Probability and Statistics for Engineering and th...
Statistics
ISBN:9781305251809
Author:Jay L. Devore
Publisher:Cengage Learning
Statistics for The Behavioral Sciences (MindTap C...
Statistics
ISBN:9781305504912
Author:Frederick J Gravetter, Larry B. Wallnau
Publisher:Cengage Learning
Elementary Statistics: Picturing the World (7th E...
Statistics
ISBN:9780134683416
Author:Ron Larson, Betsy Farber
Publisher:PEARSON
The Basic Practice of Statistics
Statistics
ISBN:9781319042578
Author:David S. Moore, William I. Notz, Michael A. Fligner
Publisher:W. H. Freeman
Introduction to the Practice of Statistics
Statistics
ISBN:9781319013387
Author:David S. Moore, George P. McCabe, Bruce A. Craig
Publisher:W. H. Freeman