MATLAB: An Introduction with Applications
6th Edition
ISBN: 9781119256830
Author: Amos Gilat
Publisher: John Wiley & Sons Inc
expand_more
expand_more
format_list_bulleted
Question

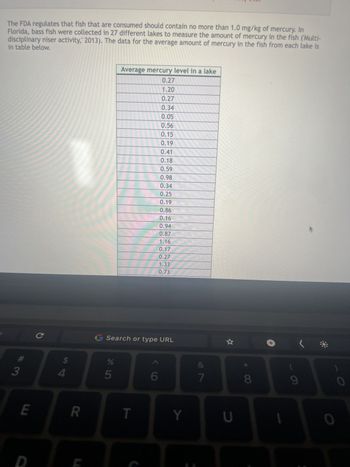
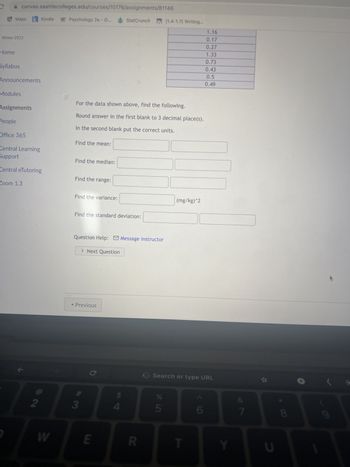
Transcribed Image Text:The FDA regulates that fish that are consumed should contain no more than 1.0 mg/kg of mercury. In
Florida, bass fish were collected in 27 different lakes to measure the amount of mercury in the fish ('Multi-
in table below.
disciplinary niser activity, 2013). The data for the average amount of mercury in the fish from each lake is
3
E
LL
C
$
4
R
G Search or type URL
65°
Average mercury level in a lake
0.27
1.20
0.27
0.34
0.05
0.56
0.15
0.19
0.41
0.18
0.59
0.98
0.34
0.25
0.19
0.86
0.16
0.94
0.87
1.16
0.17
0.27
1.33
0.73
%
T
< C
6
Y
7
*
U
8
+
(
9
0
0
Expert Solution
This question has been solved!
Explore an expertly crafted, step-by-step solution for a thorough understanding of key concepts.
This is a popular solution
Trending nowThis is a popular solution!
Step by stepSolved in 2 steps with 5 images

Knowledge Booster
Similar questions
- The amount of time a service technician needs to change the oil in a car is uniformly distributed between 11 and 21 minutes. Let X = the time needed to change the oil on a car. c. Find the 50th percentile. Round to the nearest minute.arrow_forwardUse the grouped data formulas to find the indicated mean or standard deviation. For the following data set, approximate the sample standard deviation. Height (in inches) Frequency 50-52 53-55 56-58 12 59-61 13 62-64 11 Earrow_forwardSolve the problem.The diameter of ball bearings produced in a manufacturing process can be explained using a uniform distribution over the interval 6.5 to 8.5 millimeters. What is the mean diameter produced in this manufacturing process? Select one: A. 8.0 millimeters B. 7.5 millimeters C. 8.5 millimeters D. 7.0 millimetersarrow_forward
- The amount of trash generated by US households (in lbs per day) is normally distributed. You take a sample of 10 people. The sample average is xbar=10.91 lbs, and the sample standard deviation is s=4.736. What is the 99% Conf. Int. for the mean? Group of answer choices a. 6.04 to 15.78 b. 8.33 to 13.49 c. 8.09 to 13.73 d. 7.74 to 14.08arrow_forwardFor the data: 58 102 124 161 68 104 102 find: sample mean = sample standard deviation = range = median = sample size =arrow_forwardWhat technique compares dispersion with the average of data? Select one: a. Standard deviation b. Process capability c. Variance d. Coefficient of variationarrow_forward
- Find the z-score that has 70.54% of the distribution's area to its right. Click to view page 1 of the table. Click to view page 2 of the table. O A. - 0.82 В. - 0.54 С. 0.82 D. 0.54arrow_forwardFind the standard deviation for the following data.Round your answer to 2 decimal places as needed 31,72,84,25,100,18,90,51,47,87arrow_forwardUse the standard normal table to find the z-score that corresponds to the given percentile. If the area is not in the table, use the entry closest to the area. If the area is halfway between two entries use the z-score halfway between the corresponding z-scores. If convenient, use technology to find the z-score. P 25 Click to view page 1 of the table. Click to view page 2 of the table. The z-score that corresponds to P25 is (Round to two decimal places as needed.)arrow_forward
- Find the range, the standard deviation, and the variance for the given samples. Round noninteger results to the nearest tenth. 91, 78, 89, 70, 90, 75, 84, 98, 96, 79, 77 range standard deviation variancearrow_forwardFind the z score for the 55th percentile.arrow_forwardFind the area of the shaded region. The graph to the right depicts IQ scores of adults, and those scores are normally distributed with a mean of 100 and a standard deviation of 15. Click to view page 1 of the table. Click to view page 2 of the table. The area of the shaded region is (Round to four decimal places as needed.) 70 125 Qarrow_forward
arrow_back_ios
SEE MORE QUESTIONS
arrow_forward_ios
Recommended textbooks for you
 MATLAB: An Introduction with ApplicationsStatisticsISBN:9781119256830Author:Amos GilatPublisher:John Wiley & Sons Inc
 Probability and Statistics for Engineering and th...StatisticsISBN:9781305251809Author:Jay L. DevorePublisher:Cengage Learning
 Statistics for The Behavioral Sciences (MindTap C...StatisticsISBN:9781305504912Author:Frederick J Gravetter, Larry B. WallnauPublisher:Cengage Learning
 Elementary Statistics: Picturing the World (7th E...StatisticsISBN:9780134683416Author:Ron Larson, Betsy FarberPublisher:PEARSON
 The Basic Practice of StatisticsStatisticsISBN:9781319042578Author:David S. Moore, William I. Notz, Michael A. FlignerPublisher:W. H. Freeman
 Introduction to the Practice of StatisticsStatisticsISBN:9781319013387Author:David S. Moore, George P. McCabe, Bruce A. CraigPublisher:W. H. Freeman

MATLAB: An Introduction with Applications
Statistics
ISBN:9781119256830
Author:Amos Gilat
Publisher:John Wiley & Sons Inc

Probability and Statistics for Engineering and th...
Statistics
ISBN:9781305251809
Author:Jay L. Devore
Publisher:Cengage Learning

Statistics for The Behavioral Sciences (MindTap C...
Statistics
ISBN:9781305504912
Author:Frederick J Gravetter, Larry B. Wallnau
Publisher:Cengage Learning

Elementary Statistics: Picturing the World (7th E...
Statistics
ISBN:9780134683416
Author:Ron Larson, Betsy Farber
Publisher:PEARSON

The Basic Practice of Statistics
Statistics
ISBN:9781319042578
Author:David S. Moore, William I. Notz, Michael A. Fligner
Publisher:W. H. Freeman

Introduction to the Practice of Statistics
Statistics
ISBN:9781319013387
Author:David S. Moore, George P. McCabe, Bruce A. Craig
Publisher:W. H. Freeman