
MATLAB: An Introduction with Applications
6th Edition
ISBN: 9781119256830
Author: Amos Gilat
Publisher: John Wiley & Sons Inc
expand_more
expand_more
format_list_bulleted
Related questions
Question
thumb_up100%
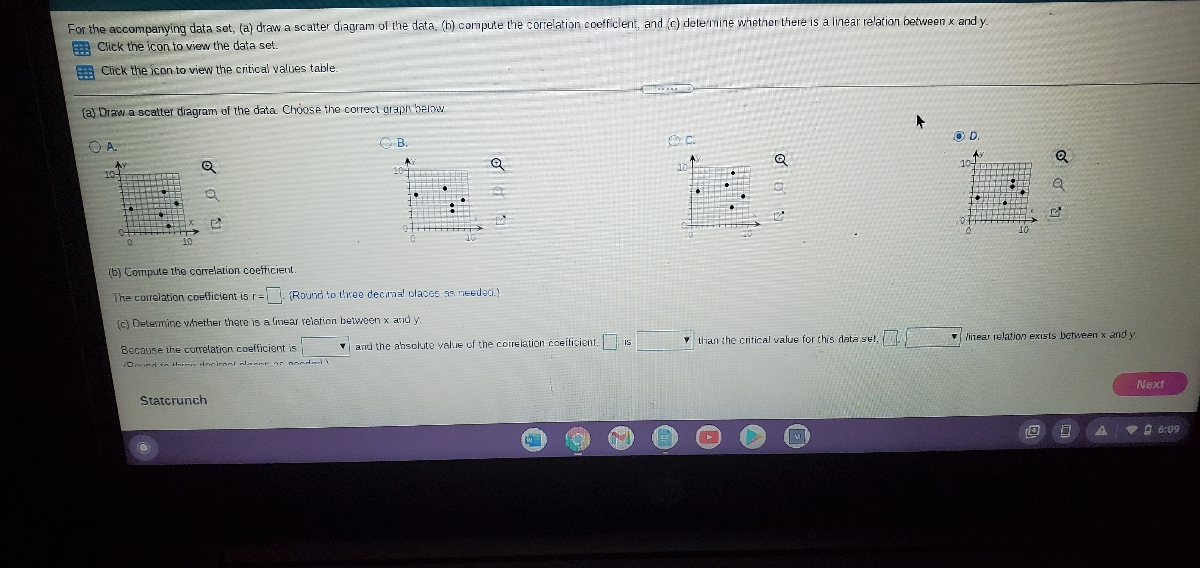

Transcribed Image Text:For the accompanying data set, (a) draw a scatter diagram of the data. (b) compute the correlation coefficient, and (c) determine whether there is a linear relation between x and y.
E Click the icon to view the data set.
A Click the icon to view the critical values table.
(a) Draw a scatter diagram of the data. Choose the correct graph below.
OD.
O A
O B.
(b) Compute the correlation coefficient
The correlation coefficient is r = (Round to three decirmal placee as needeci.)
(c) Determine whether there is a lmear relation between x and y
* than the critical value for this data sul,
linear relation exists behween x and y
Because the correlation coelficient is
V and the absolute value of the correlation coeificient. is
Next
Statcrunch
V6:09

Transcribed Image Text:toefficient, and (c) determine whether there is a linear relation between x and
Critical Values for Correlation Coefficient
3 0.997
4 0.950
L0 878
Data set
6 0.811
7 10.754
8 0.707
9 0.666
10 0 632
11 0.602
6
1.
9
3
6
9
12 0.576
13 0.553
14 0.532
15 0.514
16 0 497
Print
Done
Tinear relation exis
Done
V than the cnitical value for this data set.
Print
Statcrunch
Expert Solution
This question has been solved!
Explore an expertly crafted, step-by-step solution for a thorough understanding of key concepts.

Step by stepSolved in 2 steps with 1 images

Knowledge Booster

Similar questions
- Let x be the average number of employees in a group health insurance plan, and let y be the average administrative cost as a percentage of claims. x 3 7 15 32 75 y 40 35 30 26 18 (a) Make a scatter diagram of the data and visualize the line you think best fits the data. Flash Player version 10 or higher is required for this question. You can get Flash Player free from Adobe's website. (b) Would you say the correlation is low, moderate, or strong? positive or negative? strong and negative moderate and negative strong and positive low and negative low and positive moderate and positive (c) Use a calculator to verify that Σx = 132, Σx2 = 6932, Σy = 149, Σy2 = 4725, and Σxy = 2997. Compute r. (Round your answer to three decimal places.)r = As x increases, does the value of r imply that y should tend to increase or decrease? Explain. Given our value of r, we cannot draw any conclusions for the behavior of y as x increases. Given our value of r, y should tend to…arrow_forwardFor the accompanying data set, (a) draw a scatter diagram of the data, (b) by hand, compute the correlation coefficient, and (c) determine whether there is a linear relation between x and y. Click here to view the data set. Click here to view the critical values table. Critical values for the correlation coefficient Critical Values for Correlation Coefficient Data set 3 0.997 4 0.950 2 4 6. 6. 7 0.878 0.811 y 4 8. 12 14 19 7 0.754 8 0.707 0.666 10 0.632 11 0.602 12 0.576 13 0.553 14 0.532 15 0.514 16 0.497 17 0.482 18 0.468 19 0.456 20 0.444 21 0.433 22 0.423 23 0.413 24 0.404 25 0.396 26 0.388 27 0.381 28 0.374 29 0.367 30 0.361 Print Done narrow_forwardWhat kind of relationship is depicted in the following graph? 7 2 1 0 2 3 a. A positive linear correlation b. A nonlinear correlation c. No correlation Od. A negative linear correlation 6 9 10arrow_forward
- Need the first 3arrow_forwardGiven the graph below, what type of correlation would you predict there is between the variables? CAR PRICE DEPENDING ON AGE Price (dollars) 10000 9000 8000 7000 6000 5000 4000 3000 2000 1000- 4. 10 Age (years) O Positive correlation O Negative correlation O No correlationarrow_forwardThe data below shows the selling price (in hundred thousands) and the list price (in hundred thousands) of homes sold. Construct a scatterplot, find the value of the linear correlation coefficient r, and P-value using a = 0.05. Is there sufficient evidence to conclude that there is a linear correlation between the two variables? Selling Price (x) List Price (y) H₁: p#0 400 412 Construct a scatterplot. Choose the correct graph below. 301 315 376 387 434 440 459 488 H₁ p > 0 477 480 319 324 352 368 417 434 330 341arrow_forward
arrow_back_ios
arrow_forward_ios
Recommended textbooks for you
- MATLAB: An Introduction with ApplicationsStatisticsISBN:9781119256830Author:Amos GilatPublisher:John Wiley & Sons Inc
 Probability and Statistics for Engineering and th...StatisticsISBN:9781305251809Author:Jay L. DevorePublisher:Cengage Learning
 Statistics for The Behavioral Sciences (MindTap C...StatisticsISBN:9781305504912Author:Frederick J Gravetter, Larry B. WallnauPublisher:Cengage Learning
  Elementary Statistics: Picturing the World (7th E...StatisticsISBN:9780134683416Author:Ron Larson, Betsy FarberPublisher:PEARSON
 The Basic Practice of StatisticsStatisticsISBN:9781319042578Author:David S. Moore, William I. Notz, Michael A. FlignerPublisher:W. H. Freeman
 Introduction to the Practice of StatisticsStatisticsISBN:9781319013387Author:David S. Moore, George P. McCabe, Bruce A. CraigPublisher:W. H. Freeman
MATLAB: An Introduction with Applications
Statistics
ISBN:9781119256830
Author:Amos Gilat
Publisher:John Wiley & Sons Inc
Probability and Statistics for Engineering and th...
Statistics
ISBN:9781305251809
Author:Jay L. Devore
Publisher:Cengage Learning
Statistics for The Behavioral Sciences (MindTap C...
Statistics
ISBN:9781305504912
Author:Frederick J Gravetter, Larry B. Wallnau
Publisher:Cengage Learning
Elementary Statistics: Picturing the World (7th E...
Statistics
ISBN:9780134683416
Author:Ron Larson, Betsy Farber
Publisher:PEARSON
The Basic Practice of Statistics
Statistics
ISBN:9781319042578
Author:David S. Moore, William I. Notz, Michael A. Fligner
Publisher:W. H. Freeman
Introduction to the Practice of Statistics
Statistics
ISBN:9781319013387
Author:David S. Moore, George P. McCabe, Bruce A. Craig
Publisher:W. H. Freeman