
MATLAB: An Introduction with Applications
6th Edition
ISBN: 9781119256830
Author: Amos Gilat
Publisher: John Wiley & Sons Inc
expand_more
expand_more
format_list_bulleted
Related questions
Question
PART C: the bold indicates the options for the answer...choose one...unless it is fill in the blank.
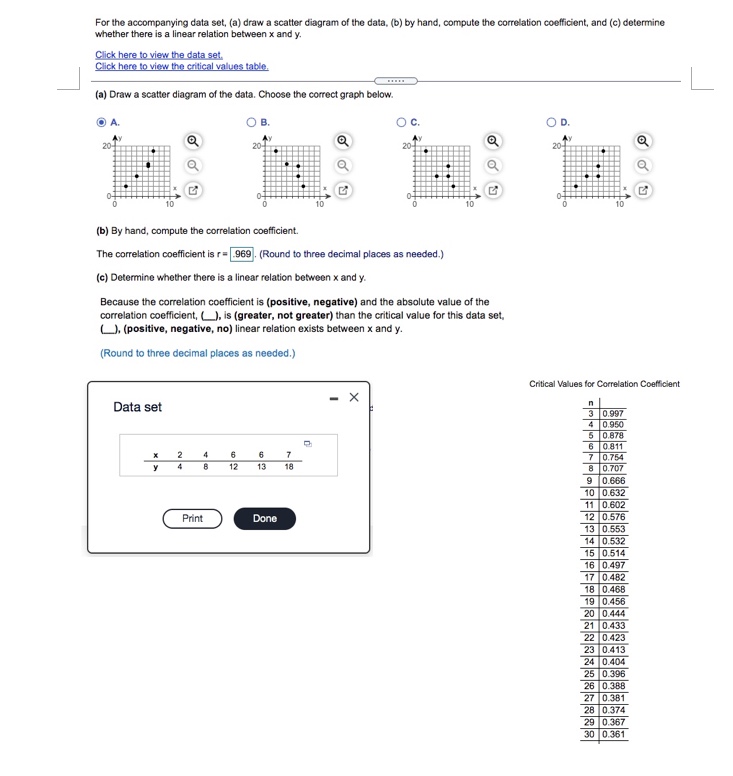

Transcribed Image Text:For the accompanying data set, (a) draw a scatter diagram of the data, (b) by hand, compute the correlation coefficient, and (c) determine
whether there is a linear relation between x and y.
Click here to view the data set.
Click here to view the critical values table.
(a) Draw a scatter diagram of the data. Choose the correct graph below.
В.
20-
20-
20-
(b) By hand, compute the correlation coefficient.
The correlation coefficient is r=969. (Round to three decimal places as needed.)
(c) Determine whether there is a linear relation between x and y.
Because the correlation coefficient is (positive, negative) and the absolute value of the
correlation coefficient, O, is (greater, not greater) than the critical value for this data set,
O). (positive, negative, no) linear relation exists between x and y.
(Round to three decimal places as needed.)
Critical Values for Correlation Coefficient
Data set
3 0.997
4 0.950
5 0.878
6 0.811
7 0.754
8 0.707
2
4
6
6
7
y
4
12
13
18
9 0.666
10 0.632
11 0.602
12 0.576
13 0.553
14 0.532
15 0.514
Print
Done
16 0.497
17 0.482
18 0.468
19 0.456
20 0.444
21 |0.433
22 |0.423
23 0.413
24 0.404
25 0.396
26 0.388
27 0.381
28 0.374
29 0.367
30 0.361
Expert Solution
This question has been solved!
Explore an expertly crafted, step-by-step solution for a thorough understanding of key concepts.

This is a popular solution

Trending nowThis is a popular solution!

Step by stepSolved in 2 steps with 1 images

Knowledge Booster

Similar questions
- How to do question 22, 26, and 28?arrow_forwardUse the following information to answer the next question Leonidas is having a party and is planning to play some great music over the dinner hour. He made a short list of 18 songs that include 10 classical songs and 8 jazz songs. Over the dinner hour it is decided that of the 18 songs, 4 classical songs and 3 jazz songs will be selected, and then arranged into an order to be played. To determine the number of potential music arrangements for the party the following expressions were created: i) 10C4 X 8C3 X 7! ii) 10P4 8P3 iii) (¹0)(3) × 5040 iv) 18P7 v) (10 x 9 x 8 x 7) × (8 × 7 × 6) vi) 11. How many of the above expressions are correct? a) 5 b) 4 (10x9x8x7) (8x7x6) X 4! 3! c) 3 x 7! d) 2arrow_forwardAssume Amy is making a sandwich for lunch and needs to select her sandwich fixings. She will select two meats out of 5 options, 1 cheese out of 3 options, and exactly 3 or exactly 5 vegetables out of the 7 options. She will also decide whether to add mayo or not. How many ways can she make her sandwich.arrow_forward
arrow_back_ios
arrow_forward_ios
Recommended textbooks for you
- MATLAB: An Introduction with ApplicationsStatisticsISBN:9781119256830Author:Amos GilatPublisher:John Wiley & Sons Inc
 Probability and Statistics for Engineering and th...StatisticsISBN:9781305251809Author:Jay L. DevorePublisher:Cengage Learning
 Statistics for The Behavioral Sciences (MindTap C...StatisticsISBN:9781305504912Author:Frederick J Gravetter, Larry B. WallnauPublisher:Cengage Learning
  Elementary Statistics: Picturing the World (7th E...StatisticsISBN:9780134683416Author:Ron Larson, Betsy FarberPublisher:PEARSON
 The Basic Practice of StatisticsStatisticsISBN:9781319042578Author:David S. Moore, William I. Notz, Michael A. FlignerPublisher:W. H. Freeman
 Introduction to the Practice of StatisticsStatisticsISBN:9781319013387Author:David S. Moore, George P. McCabe, Bruce A. CraigPublisher:W. H. Freeman
MATLAB: An Introduction with Applications
Statistics
ISBN:9781119256830
Author:Amos Gilat
Publisher:John Wiley & Sons Inc
Probability and Statistics for Engineering and th...
Statistics
ISBN:9781305251809
Author:Jay L. Devore
Publisher:Cengage Learning
Statistics for The Behavioral Sciences (MindTap C...
Statistics
ISBN:9781305504912
Author:Frederick J Gravetter, Larry B. Wallnau
Publisher:Cengage Learning
Elementary Statistics: Picturing the World (7th E...
Statistics
ISBN:9780134683416
Author:Ron Larson, Betsy Farber
Publisher:PEARSON
The Basic Practice of Statistics
Statistics
ISBN:9781319042578
Author:David S. Moore, William I. Notz, Michael A. Fligner
Publisher:W. H. Freeman
Introduction to the Practice of Statistics
Statistics
ISBN:9781319013387
Author:David S. Moore, George P. McCabe, Bruce A. Craig
Publisher:W. H. Freeman