
MATLAB: An Introduction with Applications
6th Edition
ISBN: 9781119256830
Author: Amos Gilat
Publisher: John Wiley & Sons Inc
expand_more
expand_more
format_list_bulleted
Related questions
Question
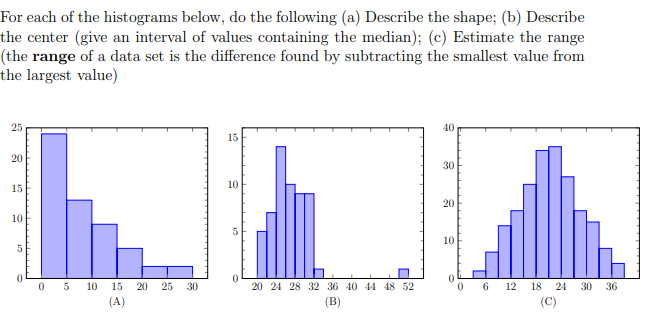

Transcribed Image Text:For each of the histograms below, do the following (a) Describe the shape; (b) Describe
the center (give an interval of values containing the median); (c) Estimate the range
(the range of a data set is the difference found by subtracting the smallest value from
the largest value)
25
20
15
10
5
0 5 10
15
(A)
20
25
30
15
10
20 24 28 32 36 40 44 48 52
(B)
40
30
20
10
0 6 12
18 24
(C)
30 36
Expert Solution
This question has been solved!
Explore an expertly crafted, step-by-step solution for a thorough understanding of key concepts.

This is a popular solution

Trending nowThis is a popular solution!

Step by stepSolved in 5 steps

Knowledge Booster

Similar questions
- The following data set shows the distances a car drives (in miles) on a full tank of gas after 15-fill ups at a gas station. Sorted Distance Per Tank of Gas 215 229 236 239 240 244 247 255 262 264 271 279 280 282 285 (i) (ii) Construct a box -and Whisker plot for the data using a five number summary. Describe the shape of the distribution.arrow_forwardName all of the following data sets that you would expect to be skewed. I. waiting times at the bankII. salaries of teachersIII. the selling price of homes IV. fuel efficiency of compact cars II and III IandII I, II, and III IVarrow_forwardUse table for questions 1a, b,c, Number of hours spent sleeping at night 5 8 6 7 4 9 8 7 5 9 8 10 7 7 8 6 8 8 7 8 9 8 7 5 9 10 7 8 8 6 1a. Find the measurer of central tendency for the data. Mean: Median: Mode: 1b. Which measure of central tendency so you think gives the best indication of the number of hours the “typical” person spends sleeping each night? Explain 1c. Suppose anotherperson was surveyed who said that he spends 3 hours sleeping at night. How would this affect the mean, median and mode? 2A. Use the given data set to solve the following problems 100, 129,105,97,112,103,241,110,117,18. Find the a) mean b) median c) mode B) What effect dose removing the outlier have on each measure of central tendency? a) mean b) Mode c) Median 3. Gray has taken an aptitude test 8 times and his scores are 96,98,105,36,87,95, and 93. Which measure of central tendency is most appropriate for his score?arrow_forward
- After giving a statistics exam, professor Dang determined the following five-number summary for her class results: 60 68 77 89 98. Use this information to draw a box plot of the exam scoresarrow_forwardHere is a data set: 36 51 46 42 43 45 39 55 43 41 43 54 41 49 51 48 44 39 53 59 You are examining the data with a split stem-and-leaf plot. Here is the start of the plot: 3 | 699 4 | 1123334 4 | 5689 51 51 What should be entered in the last row of this table? 51arrow_forwardWhich of the following is NOT an appropriate display for the variable of Grade Point Average? Group of answer choices Dot Plot Scatterplot Boxplot Stem and Leaf Plot Histogramarrow_forward
- Here is a data set: 24 18 21 32 21 29 29 35 20 39 31 18 20 18 28 22 26 22 34 34 You are examining the data with a split stem-and-leaf plot. Here is the start of the plot: 1 | 888 2 | 0011224 2 | 6899 31 3 | What should be entered in the second to last row of this table? 31 Question Help:Video Message instructorarrow_forwardConsider the following ordered data. 4 7 7 8 9 9 10 11 12 Find the low, Q1, median, Q3, and high Find the interquartile rangearrow_forwardSeveral years ago, the state of California launched an aggressively advertisement campaign against smoking. We've interviewed students from 16 college campuses in California and recorded for each campus the percentage of students who claimed that they had encountered assay least one anti smoking advertisement on campus in the past month. Here are those percentages. 53 39 30 49 48 42 41 38 26 36 40 42 52 51 45 50 Construct a box and whisker plot for the data.arrow_forward
- d. Estimate the blood pressure of the student if his stress test score is 80, 60, and 85.arrow_forwardPlease give me answer immediately.arrow_forwardIt is generally believed that there is a relationship between a college’s acceptance rate and its graduation rate. I wanted to know how strong this relationship is within the top universities in the country so I collected the graduation rate and acceptance rate data of a randomly selected sample of universities from all the top U.S. universities (with an acceptance rate at or below 30%). The data set is in Tab Q2 of the Excel data file. a.) Create a scatter plot between the two variables using Excel. Paste the plot here and format it into an APA-styled “figure” (see Assignment Guides for APA format).Be sure to submit the Excel file that you used to create the scatter plot. b) Calculate the mean and standard deviation for the two variables separately. c) Calculate the Z scores for all the scores of the two variables, separately.Tips: It may help to prevent error and to increase clarity if the process and/or the answers (z scores) are listed in a table format. d) Calculate…arrow_forward
arrow_back_ios
SEE MORE QUESTIONS
arrow_forward_ios
Recommended textbooks for you
- MATLAB: An Introduction with ApplicationsStatisticsISBN:9781119256830Author:Amos GilatPublisher:John Wiley & Sons Inc
 Probability and Statistics for Engineering and th...StatisticsISBN:9781305251809Author:Jay L. DevorePublisher:Cengage Learning
 Statistics for The Behavioral Sciences (MindTap C...StatisticsISBN:9781305504912Author:Frederick J Gravetter, Larry B. WallnauPublisher:Cengage Learning
  Elementary Statistics: Picturing the World (7th E...StatisticsISBN:9780134683416Author:Ron Larson, Betsy FarberPublisher:PEARSON
 The Basic Practice of StatisticsStatisticsISBN:9781319042578Author:David S. Moore, William I. Notz, Michael A. FlignerPublisher:W. H. Freeman
 Introduction to the Practice of StatisticsStatisticsISBN:9781319013387Author:David S. Moore, George P. McCabe, Bruce A. CraigPublisher:W. H. Freeman
MATLAB: An Introduction with Applications
Statistics
ISBN:9781119256830
Author:Amos Gilat
Publisher:John Wiley & Sons Inc
Probability and Statistics for Engineering and th...
Statistics
ISBN:9781305251809
Author:Jay L. Devore
Publisher:Cengage Learning
Statistics for The Behavioral Sciences (MindTap C...
Statistics
ISBN:9781305504912
Author:Frederick J Gravetter, Larry B. Wallnau
Publisher:Cengage Learning
Elementary Statistics: Picturing the World (7th E...
Statistics
ISBN:9780134683416
Author:Ron Larson, Betsy Farber
Publisher:PEARSON
The Basic Practice of Statistics
Statistics
ISBN:9781319042578
Author:David S. Moore, William I. Notz, Michael A. Fligner
Publisher:W. H. Freeman
Introduction to the Practice of Statistics
Statistics
ISBN:9781319013387
Author:David S. Moore, George P. McCabe, Bruce A. Craig
Publisher:W. H. Freeman