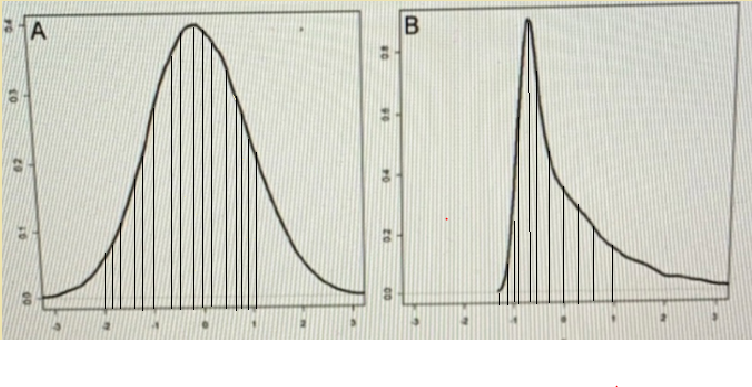
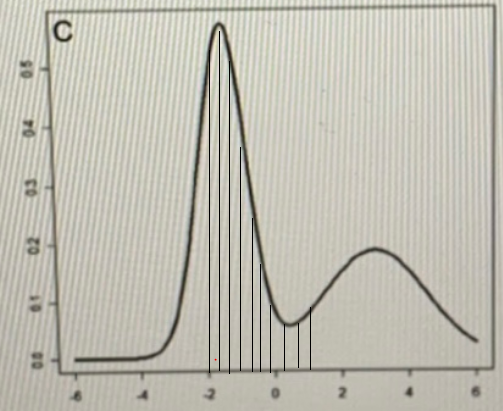
For each of the following probability density curves, shade the regions cor- (а) responding to the probability P(-2 < X < 1) where X is a random variable from those distributions: (b) If your data has a lot of outliers, what would be a good measure of spread? Suppose you have data on the number of shoes of each size sold in a fixed time (c periou (say, this year, till November). What will be a good measure of centrality for shoe sizes?


Continuous Probability Distributions
Probability distributions are of two types, which are continuous probability distributions and discrete probability distributions. A continuous probability distribution contains an infinite number of values. For example, if time is infinite: you could count from 0 to a trillion seconds, billion seconds, so on indefinitely. A discrete probability distribution consists of only a countable set of possible values.
Normal Distribution
Suppose we had to design a bathroom weighing scale, how would we decide what should be the range of the weighing machine? Would we take the highest recorded human weight in history and use that as the upper limit for our weighing scale? This may not be a great idea as the sensitivity of the scale would get reduced if the range is too large. At the same time, if we keep the upper limit too low, it may not be usable for a large percentage of the population!

a)
To shade the region corresponding to in the probability density curve we need to share the region between -2 and 1. Here in Probability density curve of A and C, the curve is defined from -2 to 1, so it is shaded with vertical lines on the curve and the curve B is shaded the region between -2 and 1 where the probability density curve is defined as shown below.

Step by step
Solved in 2 steps with 2 images


