
MATLAB: An Introduction with Applications
6th Edition
ISBN: 9781119256830
Author: Amos Gilat
Publisher: John Wiley & Sons Inc
expand_more
expand_more
format_list_bulleted
Related questions
Question
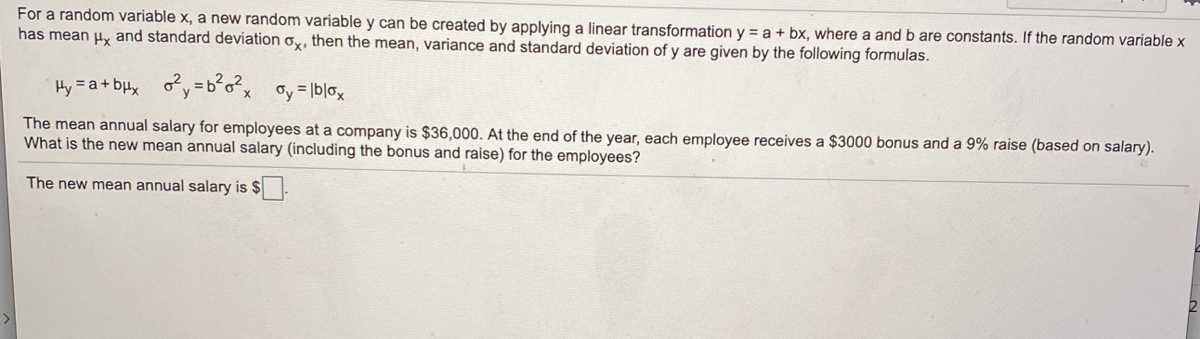

Transcribed Image Text:For a random variable x, a new random variable y can be created by applying a linear transformation y = a + bx, where a and b are constants. If the random variable x
has mean u, and standard deviation ox, then the mean, variance and standard deviation of y are given by the following formulas.
Hy = a+ bux oy=b°o²x oy= lblox
The mean annual salary for employees at a company is $36,000. At the end of the year, each employee receives a $3000 bonus and a 9% raise (based on salary).
What is the new mean annual salary (including the bonus and raise) for the employees?
The new mean annual salary is $
Expert Solution
This question has been solved!
Explore an expertly crafted, step-by-step solution for a thorough understanding of key concepts.

This is a popular solution

Trending nowThis is a popular solution!

Step by stepSolved in 2 steps

Knowledge Booster


Learn more about
Need a deep-dive on the concept behind this application? Look no further. Learn more about this topic, statistics and related others by exploring similar questions and additional content below.Similar questions
- A scientist wants to develop a model to describe the relationship between the average daily temperature, x °C, and her household’s daily energy consumption, y kWh, in winter. A random sample of the average daily temperature and her household’s daily energy consumption are taken from 10 winter days and shown in the table. x -0.4 -0.2 0.3 0.8 1.1 1.4 1.8 2.1 2.5 2.6 y 28 30 26 25 26 27 26 24 22 21 You may use: Sy=255 Sxy=283.8 Syy= 64.5 Find a value for the product moment correlation coefficient r for this data Explain what the value of the product moment corelation tells you about the relationship between daily temperature and the household energy consumption.arrow_forwardLet a be a random variable representing the percentage of protein content for early bloom alfalfa hay. The average percentage protein content of such early bloom alfalfa should be u = 17.2%. A farmer's co-op is thinking of buying a large amount of baled hay but suspects that the hay is from a later summer cutting with lower protein content. A small amount of hay was removed from each bale of a random sample of 50 bales. The average protein content from the samples was determined by a local agricultural college to be -15.8% with a sample standard deviation of S = 5.3%- At a = .05, does this hay have lower average protein content than the early bloom alfalfa?arrow_forwardit is multichoice, thank you!arrow_forward
- For a random variable X E(X) = 1.27, E(X²) = 3.79 The variance of X is equal to Select one: O 2.52 O 2.9843 O 2.1771 O 0.758 0.3351arrow_forwardLet G and H be two independent unbiased estimators of 0. Assume that the variance of G is two times the variance of H. Find the constants a andb so that aG + bH is an unbiased estimator with the smallest possible variance for such a linear combination.arrow_forwardPsi is a measure of compressive strength, or the ability of the material to carry loads and handle compression. The desired concrete psi rating used for sidewalks and residential driveways ranges from 2500psi to 3000psi obtained from mixing cement, stone, and sand in different ratios but with the same amount of water. The summary of the psi's of three (3) such concrete mixes made by three (3) different civil engineering students is given as follows: Mean vector: The variance-covariance matrix: Concrete mix Mean Concrete mix 1 Concrete mix 2 Concrete mix 3 Concrete mix 1 | Concrete mix 2 2700 18 12 2 3000 12 16 3 2400 Concrete mix 3 16 25 Let the random variable Y be the vector of the psi's of concrete mixes obtained by the students, i.e. Y1, denotes the psi of concrete mix made by student 1, Y2 is the psi of concrete mix made by student 2 and Y3 is the psi of concrete mix psi made by student 3. (a) Find (i) the multivariate probability distribution function (pdf) of Y. (ii) the…arrow_forward
- 4. As fallen trees lie on the forest floor they slowly decay. Will the amount of light present have an impact on the rate of decay? In the following table x is a random variable representing the remaining percentage of total mass of a log after it was exposed to the elements for three weeks while y represents the numbers of hours of direct sunlight the log received each day. X 0.60 .70 .65 .82 .87 y 1.0 2.3 3.0 4.0 4.5 (a) Plot a scatter diagram of the data. Remember to label your axes appropriately and choose a consistent scale. (b) Based on a scatter diagram, would you estimate the correlation coefficient to be positive, close to zero, or negative? Please circle one of the following choices: A. Positive B. Close to zero C. Negative (c) Interpret your results from parts (a) and (b). 16 tvarrow_forwardConsider an MA(2) model: STEPS -Write the equation of the M(2) model-Determine the model based on the delay operator.- Find the expected value of the model- Find the variance of the model.- Find the covariances associated with 1,2, and s steps.- Find the associated correlation indices of 1,2, and s steps.- Assume that information is available up to time $h$ and the function that contains the accumulated information f(h, h-1,……), determine the forecasts and the error associated with 1,2, and s steps.arrow_forward
arrow_back_ios
arrow_forward_ios
Recommended textbooks for you
- MATLAB: An Introduction with ApplicationsStatisticsISBN:9781119256830Author:Amos GilatPublisher:John Wiley & Sons Inc
 Probability and Statistics for Engineering and th...StatisticsISBN:9781305251809Author:Jay L. DevorePublisher:Cengage Learning
 Statistics for The Behavioral Sciences (MindTap C...StatisticsISBN:9781305504912Author:Frederick J Gravetter, Larry B. WallnauPublisher:Cengage Learning
  Elementary Statistics: Picturing the World (7th E...StatisticsISBN:9780134683416Author:Ron Larson, Betsy FarberPublisher:PEARSON
 The Basic Practice of StatisticsStatisticsISBN:9781319042578Author:David S. Moore, William I. Notz, Michael A. FlignerPublisher:W. H. Freeman
 Introduction to the Practice of StatisticsStatisticsISBN:9781319013387Author:David S. Moore, George P. McCabe, Bruce A. CraigPublisher:W. H. Freeman
MATLAB: An Introduction with Applications
Statistics
ISBN:9781119256830
Author:Amos Gilat
Publisher:John Wiley & Sons Inc
Probability and Statistics for Engineering and th...
Statistics
ISBN:9781305251809
Author:Jay L. Devore
Publisher:Cengage Learning
Statistics for The Behavioral Sciences (MindTap C...
Statistics
ISBN:9781305504912
Author:Frederick J Gravetter, Larry B. Wallnau
Publisher:Cengage Learning
Elementary Statistics: Picturing the World (7th E...
Statistics
ISBN:9780134683416
Author:Ron Larson, Betsy Farber
Publisher:PEARSON
The Basic Practice of Statistics
Statistics
ISBN:9781319042578
Author:David S. Moore, William I. Notz, Michael A. Fligner
Publisher:W. H. Freeman
Introduction to the Practice of Statistics
Statistics
ISBN:9781319013387
Author:David S. Moore, George P. McCabe, Bruce A. Craig
Publisher:W. H. Freeman