MATLAB: An Introduction with Applications
6th Edition
ISBN: 9781119256830
Author: Amos Gilat
Publisher: John Wiley & Sons Inc
expand_more
expand_more
format_list_bulleted
Question

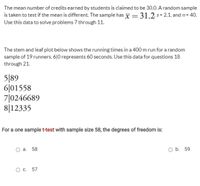
Transcribed Image Text:The mean number of credits earned by students is claimed to be 30.0. A random sample
is taken to test if the mean is different. The sample has x = 31.2 s= 2.1, and n= 40.
%3D
Use this data to solve problems 7 through 11.
The stem and leaf plot below shows the running times in a 400 m run for a random
sample of 19 runners. 6|0 represents 60 seconds. Use this data for questions 18
through 21.
5|89
6|01558
7|0246689
8|12335
For a one samplet-test with sample size 58, the degrees of freedom is:
а. 58
O b. 59
О с. 57

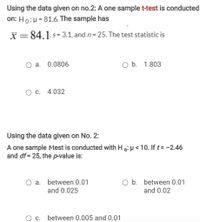
Transcribed Image Text:Using the data given on no.2: A one sample t-test is conducted
on: Ho:H = 81.6. The sample has
X=84.1 s= 3.1, and n= 25. The test statistic is
a. 0.0806
O b. 1.803
O c. 4.032
Using the data given on No. 2:
A one sample t-test is conducted with H a: H < 10. If t= -2.46
and df = 25, the p-value is:
a. between 0.01
O b. between 0.01
and 0.025
and 0.02
between 0.005 and 0.01
Expert Solution
This question has been solved!
Explore an expertly crafted, step-by-step solution for a thorough understanding of key concepts.
This is a popular solution
Trending nowThis is a popular solution!
Step by stepSolved in 3 steps with 2 images

Knowledge Booster
Similar questions
- In each of the following settings, decide whether you should use two-sample z procedures for a difference in proportions, two- sample t procedures for a difference in means, or paired t procedures for a mean difference. (a) A city planner is comparing traffic patterns at two different intersections. He randomly selects 12 times between 6:00 a.m. and 10:00 p.m., and he and his assistant count the number of cars passing through each intersection during the 10- minute interval that begins at that time. O Two-sample z test for p1 – P2 O Two-sample t test for µ – H2 Two-sample t test for x1 – x2 Paired t test for µdiff (b) How much greater is the proportion of senior citizens who attend a play at least once per year than the proportion of 20- somethings who do so? Random samples of 100 senior citizens and 100 people in their 20s were surveyed. Two-sample z test for p – P2 O Two-sample t test for x1 X2 O Two-sample t test for p1 – P2 O Two-sample t test for µ – µ2 (c) Luke's taco shop is…arrow_forwardIn a survey of 175 females who recently completed high school, 76% were enrolled in college. In a survey of 150 males who recently completed high school, 72% were enrolled in college. At a = 0.05, can you reject the claim that there is no difference in the proportion of college enrollees between the two groups? Assume the random samples are independent. Complete parts (a) through (e). O A. Ho: P1 #P2 Ha: P1 = P2 O B. Ho: P1 P2 OF. Ho: P1 = P2 O D. Ho: P1 > P2 Ha: P1 SP2 Ha: P1 O B. z 1.96 O D.arrow_forwardA local McDonald's manager will return a shipment of hamburger buns if more than 10% of the buns are crushed. A random sample of 81 buns finds 13 crushed buns. A 5% significance test is conducted to determine if the shipment should be accepted. The p value for this situation is:arrow_forwardIn a survey, 37% of the respondents stated that they talk to their pets on the telephone. A veterinarian believed this result to be too high, so he randomly selected 200 pet owners and discovered that 73 of them spoke to their pet on the telephone. Does the veterinarian have a right to be skeptical? Use the a = 0.1 level of significance. Because npo (1- Po) 10, the sample size is 5% of the population size, and the sample the requirements for testing the hypothesis satisfied. (Round to one decimal place as needed.) Enter your answer in the answer box and then click Check Answer. ? 4 parts remaining Clear All Check Answer Screen Shot 202...png Show Allarrow_forwardFor a two-tailed test with a sample size of 17 and a 0.20 level of significance, the t value is O a. 1.337 O b. 0.865 O c. 1.230 d. 1.734 Oarrow_forwardListed below are the lead concentrations (in µg/g) measured in different Ayurveda medicines. Ayurveda is a traditional medical system commonly used in India. The lead concentrations listed here are from medicines manufactured in the United States. Assume that a simple random sample has been selected. Use a 0.01 significance level to test the claim that the mean lead concentration for all such medicines is less than 14.0 μg/g. 2.95 6.46 6.00 5.46 20.49 7.51 12.02 20.45 11.50 17.54 Identify the null and alternative hypotheses. Ho H₁: (Type integers or decimals. Do not round.)arrow_forwardIf you have samples of n1=19 and n2=24, in performing the pooled-variance t test, how many degrees of freedom do you have?arrow_forwardThe manufacturer of a popular soft drink claims that cans of this drink contain 12 ounces. A consumer group is suspicious of this claim and believes the amount in each can is less than 12 ounces. A random sample of 18 cans is selected and the amount in each can is measured. The results are as follows: 11.9 11.9 12.0 11.9 12.0 11.7 11.6 11.5 11.6 12.0 11.8 11.7 12.2 11.5 12.1 11.8 12.1 11.8 Calculate the sample standard deviation s. Round its value to two decimal places.____________arrow_forwardUse the data and table below to test the indicated claim about the means of two paired populations (matched pairs). Assume that the two samples are each simple random samples selected from normally distributed populations. Make sure you identify all values. The table below shows the blood glucose of 20 students before breakfast and two hours after breakfast, using a specific insulin dosing formula to cover carbohydrates. Is there compelling statistical evidence that the specific insulin dosing formula is effective in reducing blood glucose levels? Use a significance level of 0.05. We have the differences (gain or loss), but we still need to compute the mean, standard deviation, and know the sample size for the differences (use Excel or Sheets for this computation). Once those are found, we can apply methods that are used for a 1 sample t-test. Student Before Meal After Meal Difference 1 161 114 -47 2 196 88 -108 3 132 80 -52 4 175 96 -79 5 169 112 -57 6 138 137…arrow_forwardarrow_back_iosarrow_forward_ios
Recommended textbooks for you
 MATLAB: An Introduction with ApplicationsStatisticsISBN:9781119256830Author:Amos GilatPublisher:John Wiley & Sons Inc
 Probability and Statistics for Engineering and th...StatisticsISBN:9781305251809Author:Jay L. DevorePublisher:Cengage Learning
 Statistics for The Behavioral Sciences (MindTap C...StatisticsISBN:9781305504912Author:Frederick J Gravetter, Larry B. WallnauPublisher:Cengage Learning
 Elementary Statistics: Picturing the World (7th E...StatisticsISBN:9780134683416Author:Ron Larson, Betsy FarberPublisher:PEARSON
 The Basic Practice of StatisticsStatisticsISBN:9781319042578Author:David S. Moore, William I. Notz, Michael A. FlignerPublisher:W. H. Freeman
 Introduction to the Practice of StatisticsStatisticsISBN:9781319013387Author:David S. Moore, George P. McCabe, Bruce A. CraigPublisher:W. H. Freeman

MATLAB: An Introduction with Applications
Statistics
ISBN:9781119256830
Author:Amos Gilat
Publisher:John Wiley & Sons Inc

Probability and Statistics for Engineering and th...
Statistics
ISBN:9781305251809
Author:Jay L. Devore
Publisher:Cengage Learning

Statistics for The Behavioral Sciences (MindTap C...
Statistics
ISBN:9781305504912
Author:Frederick J Gravetter, Larry B. Wallnau
Publisher:Cengage Learning

Elementary Statistics: Picturing the World (7th E...
Statistics
ISBN:9780134683416
Author:Ron Larson, Betsy Farber
Publisher:PEARSON

The Basic Practice of Statistics
Statistics
ISBN:9781319042578
Author:David S. Moore, William I. Notz, Michael A. Fligner
Publisher:W. H. Freeman

Introduction to the Practice of Statistics
Statistics
ISBN:9781319013387
Author:David S. Moore, George P. McCabe, Bruce A. Craig
Publisher:W. H. Freeman