
MATLAB: An Introduction with Applications
6th Edition
ISBN: 9781119256830
Author: Amos Gilat
Publisher: John Wiley & Sons Inc
expand_more
expand_more
format_list_bulleted
Related questions
Question
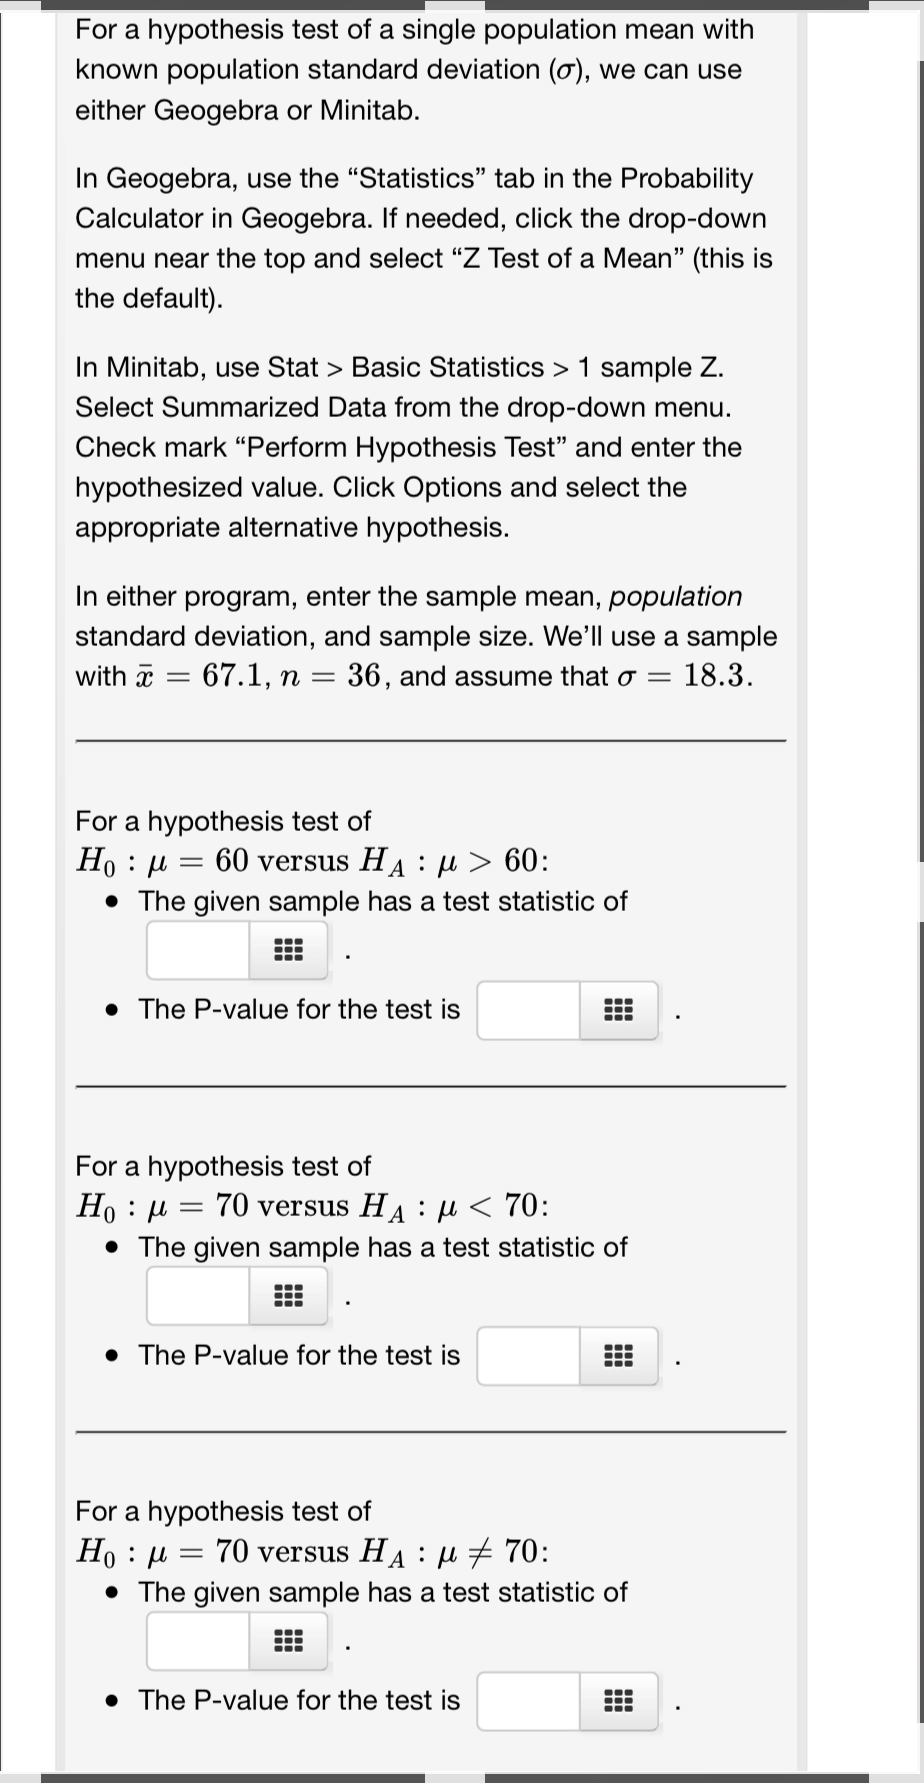

Transcribed Image Text:For a hypothesis test of a single population mean with
known population standard deviation (o), we can use
either Geogebra or Minitab.
In Geogebra, use the "Statistics" tab in the Probability
Calculator in Geogebra. If needed, click the drop-down
menu near the top and select "Z Test of a Mean" (this is
the default).
In Minitab, use Stat > Basic Statistics > 1 sample Z.
Select Summarized Data from the drop-down menu.
Check mark "Perform Hypothesis Test" and enter the
hypothesized value. Click Options and select the
appropriate alternative hypothesis.
In either program, enter the sample mean, population
standard deviation, and sample size. We'll use a sample
with x = 67.1, n = 36, and assume that o = - 18.3.
For a hypothesis test of
Ho
= 60 versus H₁ μ> 60:
• The given sample has a test statistic of
• The P-value for the test is
For a hypothesis test of
Hop=
70 versus HA: μ< 70:
• The given sample has a test statistic of
=
• The P-value for the test is
For a hypothesis test of
Ho μ = 70 versus H₁ μ70:
A
• The given sample has a test statistic of
• The P-value for the test is
Expert Solution
This question has been solved!
Explore an expertly crafted, step-by-step solution for a thorough understanding of key concepts.

This is a popular solution

Trending nowThis is a popular solution!

Step by stepSolved in 4 steps with 3 images

Knowledge Booster

Similar questions
- A researcher wants to analyse whether there is a relationship between country of origin of International students in Sydney and the suburb they currently live in. Suggest data collection approach for the researcher.arrow_forwardColleges announce an "average" SAT score for their entering freshmen. Usually the college would like this "average" to be as high as possible. A NewYork Times article noted, "Private colleges that buy lots of top students with merit scholarships prefer the mean, while open-enrollment public instituions like medians." Use what you know about the behavior of means and medians to explain these differences.arrow_forwardThe blue catfish (Ictalurus Furcatus) is the largest species of North Amercian catfish. The current world record stands at 143 pounds, which was caught in the John H. Kerr Reservoir (Bugg's Island Lake) located in Virginia. According to Amercian Expedition, the average weight of a blue catfish is between 20 to 40 pounds. Given that the largest blue catfish ever caught was at the John H. Kerr Reservoir, you believe that the mean weight of the fish in this reservoir is greater than 40 pounds. If you are going to test this claim, what would be your null and alternative hypotheses? Ho: HA: p> v Submit Questionarrow_forward
- The blue catfish (Ictalurus Furcatus) is the largest species of North American catfish. The current world record stands at 143 pounds, which was caught in the John H. Kerr Reservoir (Bugg's Island Lake) located in Virginia. According to American Expedition, the average weight of a blue catfish is between 20 to 40 pounds. Given that the largest blue catfish ever caught was at the John H. Kerr Reservoir, you believe that the mean weight of the fish in this reservoir is greater than 40 pounds. Use the data below, which represents the summary statistics for 42 blue catfish caught at this reservoir, and a 0.05 significance level to test the claim that the mean weight of the fish in the John H. Kerr Reservoir is greater than 40 pounds. n=42; ¯x=40.63 pounds; s=3.49 pounds a) Identify the null and alternative hypotheses?H0: H1: c) Identify the appropriate significance level.d) Calculate your test statistic. Write the result below, and be sure to round your final answer to two…arrow_forwardFind a real-life example of the use of ANOVA (Make sure to cite the source). Explain how and why they used ANOVA.arrow_forwardThe blue catfish (Ictalurus Furcatus) is the largest species of North American catfish. The current world record stands at 143 pounds, which was caught in the John H. Kerr Reservoir (Bugg's Island Lake) located in Virginia. According to American Expedition, the average weight of a blue catfish is between 20 to 40 pounds. Given that the largest blue catfish ever caught was at the John H. Kerr Reservoir, you believe that the mean weight of the fish in this reservoir is greater than 40 pounds. Use the data below, which represents the summary statistics for 50 blue catfish caught at this reservoir, and a 0.05 significance level to test the claim that the mean weight of the fish in the John H. Kerr Reservoir is greater than 40 pounds. n=50 ; ¯x=40.49 pounds; s=3.49 pounds a) Identify the null and alternative hypotheses? H0: H1: b) What type of hypothesis test should you conduct (left-, right-, or two-tailed)? left-tailed right-tailed two-tailed c) Identify the appropriate significance…arrow_forward
- The variablilty of statistics is described byarrow_forwardThe blue catfish (Ictalurus Furcatus) is the largest species of North American catfish. The current world record stands at 143 pounds, which was caught in the John H. Kerr Reservoir (Bugg's Island Lake) located in Virginia. According to American Expedition, the average weight of a blue catfish is between 20 to 40 pounds. Given that the largest blue catfish ever caught was at the John H. Kerr Reservoir, you believe that the mean weight of the fish in this reservoir is greater than 40 pounds. Use the data below, which represents the summary statistics for 48 blue catfish caught at this reservoir, and a 0.05 significance level to test the claim that the mean weight of the fish in the John H. Kerr Reservoir is greater than 40 pounds.arrow_forward
arrow_back_ios
arrow_forward_ios
Recommended textbooks for you
- MATLAB: An Introduction with ApplicationsStatisticsISBN:9781119256830Author:Amos GilatPublisher:John Wiley & Sons Inc
 Probability and Statistics for Engineering and th...StatisticsISBN:9781305251809Author:Jay L. DevorePublisher:Cengage Learning
 Statistics for The Behavioral Sciences (MindTap C...StatisticsISBN:9781305504912Author:Frederick J Gravetter, Larry B. WallnauPublisher:Cengage Learning
  Elementary Statistics: Picturing the World (7th E...StatisticsISBN:9780134683416Author:Ron Larson, Betsy FarberPublisher:PEARSON
 The Basic Practice of StatisticsStatisticsISBN:9781319042578Author:David S. Moore, William I. Notz, Michael A. FlignerPublisher:W. H. Freeman
 Introduction to the Practice of StatisticsStatisticsISBN:9781319013387Author:David S. Moore, George P. McCabe, Bruce A. CraigPublisher:W. H. Freeman
MATLAB: An Introduction with Applications
Statistics
ISBN:9781119256830
Author:Amos Gilat
Publisher:John Wiley & Sons Inc
Probability and Statistics for Engineering and th...
Statistics
ISBN:9781305251809
Author:Jay L. Devore
Publisher:Cengage Learning
Statistics for The Behavioral Sciences (MindTap C...
Statistics
ISBN:9781305504912
Author:Frederick J Gravetter, Larry B. Wallnau
Publisher:Cengage Learning
Elementary Statistics: Picturing the World (7th E...
Statistics
ISBN:9780134683416
Author:Ron Larson, Betsy Farber
Publisher:PEARSON
The Basic Practice of Statistics
Statistics
ISBN:9781319042578
Author:David S. Moore, William I. Notz, Michael A. Fligner
Publisher:W. H. Freeman
Introduction to the Practice of Statistics
Statistics
ISBN:9781319013387
Author:David S. Moore, George P. McCabe, Bruce A. Craig
Publisher:W. H. Freeman