MATLAB: An Introduction with Applications
6th Edition
ISBN: 9781119256830
Author: Amos Gilat
Publisher: John Wiley & Sons Inc
expand_more
expand_more
format_list_bulleted
Question

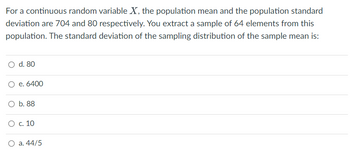
Transcribed Image Text:For a continuous random variable X, the population mean and the population standard
deviation are 704 and 80 respectively. You extract a sample of 64 elements from this
population. The standard deviation of the sampling distribution of the sample mean is:
O d. 80
O e. 6400
O b. 88
O c. 10
a. 44/5
Expert Solution
This question has been solved!
Explore an expertly crafted, step-by-step solution for a thorough understanding of key concepts.
This is a popular solution
Trending nowThis is a popular solution!
Step by stepSolved in 3 steps

Knowledge Booster
Similar questions
- 3. The data {15, 20, 20, 25} represent odometer readings (in 10000 km) for some used cars on a used-car lot. Use the data to determine the standard deviation. Population Sample Σ(x-x) n-1 0 = Σ(x-μ)² N S =arrow_forwardFind the standard deviation of the sampling distribution of sample means using the given information. Round to one decimal place, if necessary. μ=32 and σ=6; n=9arrow_forwardA simple random sample is taken from a population and yields the following data for a variable of the population. 10 38 17 33 31 12 12 17 31 27 Find a point estimate for the population mean (that is, the mean of the variable). A point estimate for the population mean is. (Round to one decimal place as needed.)arrow_forward
- Given the sample data. x: 23, 17, 15, 32, 27Use the defining formulas to compute the sample variance s2 and sample standard deviation s. (For each answer, enter a number. Round your answers to two decimal places.)s2 = s = (e) Suppose the given data comprise the entire population of all x values. Compute the population variance σ2 and population standard deviation σ. (For each answer, enter a number. Round your answers to two decimal places.)σ2 = σ =arrow_forwardAssume a population of 1, 4, and 10. Assume that samples of size n= 2 are randomly selected with replacement from the population. Listed below are the nine different samples. Complete parts a through d below. 1,1 1,4 1,10 4,1 4,4 4,10 10,1 10,4 10,10 ... a. Find the value of the population standard deviation o. (Round to three decimal places as needed.) b. Find the standard deviation of each of the nine samples, then summarize the sampling distribution of the standard deviations in the format of a table representing the probability distribution of the distinct standard deviation values. Use ascending order of the sample standard deviations. Probabilityarrow_forwardA variable of a population has a mean of μ=100 and a standard deviation of σ=42 a. The sampling distribution of the sample mean for samples of size 49 is approximately normally distributed with mean ____ and standard deviation ____ b. For part (a) to be true, what assumption did you make about the distribution of the variable under consideration?A. Normal distribution.B. No assumption was made.C. Uniform distribution. c. Is the statement in part (a) still true if the sample size is 16 instead of 49? Why or why not?A. No, the sampling distribution of the sample mean is never normal for sample size less than 30.B. No. Because the distribution of the variable under consideration is not specified, a sample size of at least 30 is needed for part (a) to be true.C. Yes, the sampling distribution of the sample mean is always normal.arrow_forward
- please solve all parts( A- E) by using R studioarrow_forwardAssume a population of 3, 5, and 10.Assume that samples of size n=2 are randomly selected with replacement from the population. Listed below are the nine different samples. Complete parts a through d below. 3,3 3,5 3,10 5,3 5,5 5,10 10,3 10,5 10,10 Find the value of the population standard deviation σ. b. Find the standard deviation of each of the nine samples, then summarize the sampling distribution of the standard deviations in the format of a table representing the probability distribution of the distinct standard deviation values. Use ascending order of the sample standard deviations. Find the mean of the sampling distribution of the sample standard deviations. the mean of the sampling distribution of the sample standard deviations isarrow_forward
arrow_back_ios
arrow_forward_ios
Recommended textbooks for you
 MATLAB: An Introduction with ApplicationsStatisticsISBN:9781119256830Author:Amos GilatPublisher:John Wiley & Sons Inc
 Probability and Statistics for Engineering and th...StatisticsISBN:9781305251809Author:Jay L. DevorePublisher:Cengage Learning
 Statistics for The Behavioral Sciences (MindTap C...StatisticsISBN:9781305504912Author:Frederick J Gravetter, Larry B. WallnauPublisher:Cengage Learning
 Elementary Statistics: Picturing the World (7th E...StatisticsISBN:9780134683416Author:Ron Larson, Betsy FarberPublisher:PEARSON
 The Basic Practice of StatisticsStatisticsISBN:9781319042578Author:David S. Moore, William I. Notz, Michael A. FlignerPublisher:W. H. Freeman
 Introduction to the Practice of StatisticsStatisticsISBN:9781319013387Author:David S. Moore, George P. McCabe, Bruce A. CraigPublisher:W. H. Freeman

MATLAB: An Introduction with Applications
Statistics
ISBN:9781119256830
Author:Amos Gilat
Publisher:John Wiley & Sons Inc

Probability and Statistics for Engineering and th...
Statistics
ISBN:9781305251809
Author:Jay L. Devore
Publisher:Cengage Learning

Statistics for The Behavioral Sciences (MindTap C...
Statistics
ISBN:9781305504912
Author:Frederick J Gravetter, Larry B. Wallnau
Publisher:Cengage Learning

Elementary Statistics: Picturing the World (7th E...
Statistics
ISBN:9780134683416
Author:Ron Larson, Betsy Farber
Publisher:PEARSON

The Basic Practice of Statistics
Statistics
ISBN:9781319042578
Author:David S. Moore, William I. Notz, Michael A. Fligner
Publisher:W. H. Freeman

Introduction to the Practice of Statistics
Statistics
ISBN:9781319013387
Author:David S. Moore, George P. McCabe, Bruce A. Craig
Publisher:W. H. Freeman