
MATLAB: An Introduction with Applications
6th Edition
ISBN: 9781119256830
Author: Amos Gilat
Publisher: John Wiley & Sons Inc
expand_more
expand_more
format_list_bulleted
Related questions
Question
thumb_up100%
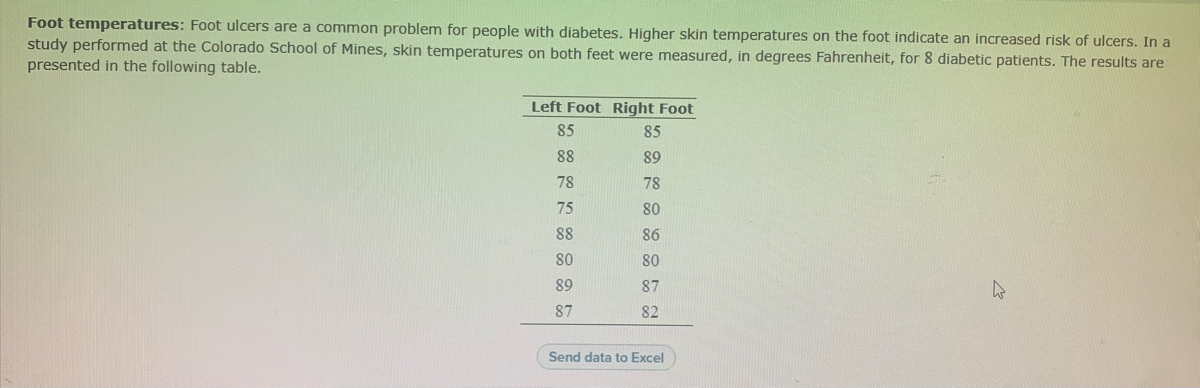

Transcribed Image Text:Foot temperatures: Foot ulcers are a common problem for people with diabetes. Higher skin temperatures on the foot indicate an increased risk of ulcers. In a
study performed at the Colorado School of Mines, skin temperatures on both feet were measured, in degrees Fahrenheit, for 8 diabetic patients. The results are
presented in the following table.
Left Foot Right Foot
85
85
88
89
78
78
75
80
88
86
80
80
89
87
h
87
82
Send data to Excel

Transcribed Image Text:Part: 0 / 5
Part 1 of 5
(a) Compute the least-squares regression line for predicting the right foot temperatures from the left foot temperature. Round the slope and y-intercept
values to four decimal places.
=
X
Ś
Regression line equation: y
Expert Solution
This question has been solved!
Explore an expertly crafted, step-by-step solution for a thorough understanding of key concepts.

This is a popular solution

Trending nowThis is a popular solution!

Step by stepSolved in 3 steps with 3 images

Knowledge Booster

Similar questions
- The price drivers pay for gasoline often varies a great deal across regions throughout the United States. The following data show the price per gallon for regular gasoline for a random sample of gasoline service stations for three major brands of gasoline (Shell, BP, and Marathon) located in eleven metropolitan areas across the upper Midwest region (OhioGasPrices.com website, March 18, 2012). Click on the datafile logo to reference the data. DATA file Shell BP Metropolitan Area Marathon Akron, Ohio Cincinnati, Ohio Cleveland, Ohio Columbus, Ohio Ft. Wayne, Indiana Indianapolis, Indiana Lansing, Michigan Lexington, Kentucky Louisville, Kentucky Muncie, Indiana Toledo, Ohio 3.77 3.72 3.87 3.76 3.78 3.87 3.89 3.79 3.83 3.83 3.85 3.77 3.83 3.85 3.93 3.84 3.84 4.04 3.87 3.87 3.99 3.79 3.78 3.81 3.69 3.78 3.84 3.84 3.83 3.79 3.79 3.86 3.86 Use a = .05 to test for any significant difference in the mean price of gasoline for the three brands. Round SS to 6 decimals, MS to 6 decimals, F to 2…arrow_forwardResearchers Holdgate et al. (2016) studied walking behavior of elephants in North American zoos to see if there is a difference in average distance traveled by African and Asian elephants. They put GPS loggers on 33 African elephants and 23 Asian elephants and measured the distance (in kilometers) the elephants walked per day. The data in the file below Elephants contains results that are consistent with what the researchers found: Species Distance: African 6.12 African 3.65 African 4.26 African 3.8 African 5.23 African 5.02 African 5.17 African 5.37 African 4.89 African 6.4 African 6.42 African 6.85 African 3.38 African 7.71 African 4.02 African 3.52 African 5.81 African 5.83 African 7.02 African 6.11 African 4.62 African 5.54 African 3.2 African 5.49 African 5.47 African 6.97 African 3.74 African 3.04 African 7.84 African 8.62 African 7.63 African 5.25 African 4.19 Asian 1.39 Asian 2.59 Asian 8.03 Asian 7.93 Asian 0.33 Asian 8.22 Asian 6.95 Asian 2.39 Asian 3.89 Asian 10.53 Asian…arrow_forwardOn occasion, medical studies need to model the proportion of the population that has a disease and compare that to observed frequencies of the disease actually occurring. Suppose the end-stage renal failure in south-west Wales was collected for different age groups. Do the data in the table show that the observed frequencies are in agreement with proportion of people in each age group? Test at the 1% level. Renal Failure Frequencies Age group 16-29 30-44 45-59 60-74 75+ Total Observed Frequencies 125 152 134 124 48 583 Expected Proportion 0.23 0.25 0.22 0.21 0.09 State the hypotheses.H0: The observed frequencies in agreement with proportion of people in each age group.Ha: The observed frequencies in agreement with proportion of people in each age group. Calculate the χ2 test statistic. Round expected values to two decimal places. Round χ2 to 3 decimal places.χ2 = Calculate the p-value. Round to 3 decimal places.p-value = State your decision.Since p-value α,…arrow_forward
- Investigation 3.2: Valence Differences Between R&B and Rap Genres (Paired)A music fan claims that R&B songs tend to have a more positive tone on average than do Rapsongs. The individual collected two independent random samples from the population of SpotifySongs. Fifteen R&B songs and another fifteen Rap songs were collected and their Valence wasrecorded. The music fan believed that pairing the song by their Danceability may provideadditional information. Danceability describes how suitable a track is for dancing based on acombination of musical elements including tempo, rhythm stability, beat strength, and overallregularity. A value of 0.0 is least danceable and 1 is most danceable. Thus, the individual pairedthe R&B song with the lowest danceability with the Rap song with the lowest danceability,followed by the second and second, third and third. She continued this process until the R&Bsong with the highest danceability was paired with the Rap song with the…arrow_forwardIn a study, the data you collect is the number of women management in a Fortune 500 company. What type of data is this? Qualitative (Categorical) Quantitative - Discrete Quantitative - Continuousarrow_forwardYou are examining two data sets involving test scores, set A and set B. The score 96 appears in both data sets. In which of the following data sets does 96 represent a higher score? Explain.(a) The percentile rank of 96 is higher in set B than in set A. A. 96 represents a higher score in Set A because a larger percentage of scores fall below 96 in set A.B. 96 represents a higher score in Set B because a larger percentage of scores fall below 96 in set B. C. 96 represents an equivalent score in both sets because an equal percentage of scores fall below 96 in both sets.D. It is impossible to tell in which set 96 represents a higher score because a percentage depends on the number of test scores in the set, which is unknown. (b) The mean is 90 in both data sets, but set A has a higher standard deviation.A. 96 represents a higher score in Set A because 96 is more standard deviations above the mean.B. 96 represents a higher score in Set B because 96 is more standard deviations above the…arrow_forward
- A psychologist believed that as children get older, they engage in more “inactive activities” such as playing computer games, watching TV and surfing the internet. She collected data from 10 children. She recorded the age of each child and the amount of activity (in hours) the child engaged in per week. Age Activity 7 4.3 9 3.2 10 1 13 1.5 12 1.2 15 0.8 9 3 12 4 15 1.5 14 1.9 Using excel, obtain a scatterplot of the data. Discuss the relationship between age and activity based on the scatterplot. Using excel, obtain the simple linear regression linear regression line predicting activity from age. Interpret the intercept and slope of the regression line. By hand, predict the amount of activity for age = 14. By hand, calculate the residual for age = 14 Using excel output, test the null hypothesis that the slope coefficient is zero using the p-value approach. Write one sentence interpreting the meaning of this result. Make sure to report the test statistic…arrow_forwardRecent research indicates that the effectiveness of antidepressant medication is directly related to the severity of the depression (Khan, Brodhead, Kolts & Brown, 2005). Based on pretreatment depression scores, patients were divided into four groups based on their level of depression. After receiving the antidepressant medication, depression scores were measured again and the amount of improvement was recorded for each patient. The following data are similar to the results of the study. Low Moderate High Moderate Moderately Severe Severe 1.6 2.9 3.8 3.4 0.9 1.3 3 2.8 1.8 3.1 3.3 3.2 2.7 3.7 2.4 4.9 3.8 2.9 3.7 3.2 4.9 1.7 From this table, conduct an one-way ANOVA. Calculate the F-ratio and p-value. Be sure to round your answers to three decimal places. Assume all population and ANOVA requirements are met. F-ratio: p-value: What is your final conclusion? Use a significance level of a = 0.01. O There is sufficient evidence that there exists a significant difference between treatments. O…arrow_forwardA psychologist believes that the age of an adolescent will have an impact on the number of phone calls made to the opposite sex (in heterosexual people) over the course of one month. They also suspect that gender of the adolescent will have an impact on the number of phone calls made to the opposite sex. Using the hypothetical data provided below, run your analyses in R to test whether age and gender impacts the number of phone calls an adolescent makes. Gender (Binary) Girl Boy Age Young Adolescents (11-14) 7, 2, 3, 5, 3 1, 2, 3, 2, 1 Older Adolescents (15-18) 15, 26, 19, 21, 18 10, 8, 5, 16, 9 ( What kind of statistical analysis do you need to use and why? State the null and alternative hypotheses. Check your assumptions. Include screenshots of your R output and explain why each of them are or are not met. Using R, run your analysis and include a screenshot. Using R, run post-hoc tests and include a screenshot. What do you…arrow_forward
arrow_back_ios
arrow_forward_ios
Recommended textbooks for you
- MATLAB: An Introduction with ApplicationsStatisticsISBN:9781119256830Author:Amos GilatPublisher:John Wiley & Sons Inc
 Probability and Statistics for Engineering and th...StatisticsISBN:9781305251809Author:Jay L. DevorePublisher:Cengage Learning
 Statistics for The Behavioral Sciences (MindTap C...StatisticsISBN:9781305504912Author:Frederick J Gravetter, Larry B. WallnauPublisher:Cengage Learning
  Elementary Statistics: Picturing the World (7th E...StatisticsISBN:9780134683416Author:Ron Larson, Betsy FarberPublisher:PEARSON
 The Basic Practice of StatisticsStatisticsISBN:9781319042578Author:David S. Moore, William I. Notz, Michael A. FlignerPublisher:W. H. Freeman
 Introduction to the Practice of StatisticsStatisticsISBN:9781319013387Author:David S. Moore, George P. McCabe, Bruce A. CraigPublisher:W. H. Freeman
MATLAB: An Introduction with Applications
Statistics
ISBN:9781119256830
Author:Amos Gilat
Publisher:John Wiley & Sons Inc
Probability and Statistics for Engineering and th...
Statistics
ISBN:9781305251809
Author:Jay L. Devore
Publisher:Cengage Learning
Statistics for The Behavioral Sciences (MindTap C...
Statistics
ISBN:9781305504912
Author:Frederick J Gravetter, Larry B. Wallnau
Publisher:Cengage Learning
Elementary Statistics: Picturing the World (7th E...
Statistics
ISBN:9780134683416
Author:Ron Larson, Betsy Farber
Publisher:PEARSON
The Basic Practice of Statistics
Statistics
ISBN:9781319042578
Author:David S. Moore, William I. Notz, Michael A. Fligner
Publisher:W. H. Freeman
Introduction to the Practice of Statistics
Statistics
ISBN:9781319013387
Author:David S. Moore, George P. McCabe, Bruce A. Craig
Publisher:W. H. Freeman