
Database System Concepts
7th Edition
ISBN: 9780078022159
Author: Abraham Silberschatz Professor, Henry F. Korth, S. Sudarshan
Publisher: McGraw-Hill Education
expand_more
expand_more
format_list_bulleted
Related questions
Question
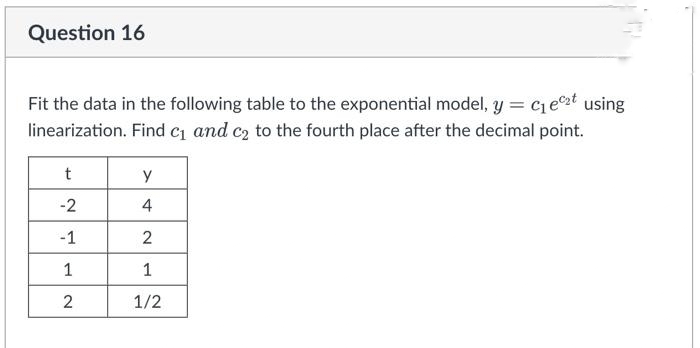

Transcribed Image Text:Question 16
Fit the data in the following table to the exponential model, y = C₁ et using
linearization. Find c₁ and c₂ to the fourth place after the decimal point.
t
Y
-2
4
-1
2
1
1
2
1/2
Expert Solution
This question has been solved!
Explore an expertly crafted, step-by-step solution for a thorough understanding of key concepts.

This is a popular solution

Trending nowThis is a popular solution!

Step by stepSolved in 2 steps with 22 images

Knowledge Booster


Learn more about
Need a deep-dive on the concept behind this application? Look no further. Learn more about this topic, computer-science and related others by exploring similar questions and additional content below.Similar questions
- Consider fitting a linear regression he(x) = 0Tx = 01x1+ 02x2+ O3x3 to a training dataset D = {(x1,y1),..., (xn, Yn)}, where 0 = [01, 02, 03]T and x = [#1, x2, 83]T Q1.1 Let D = {([1,0, 0]",0), ([0, 1, 0]" , 0.5), ([0, 0, 1]", – 1)}. Our current estimate of the parameter 0 = [0, 0, 0]T. which training instance makes the smallest contribution to the gradient ? (contribution means the magnitude of gradient change) O 1 O 2 O 3 Q1.2. What is the updated parameter after one step of gradient descent (assuming step size = 1)? O [0, 0, 0]T O (0, 1, 0]" О (), 0.5, — 1]7 O [0, 0.5, 1]"arrow_forwardIn R, write a function that produces plots of statistical power versus sample size for simple linear regression. The function should be of the form LinRegPower(N,B,A,sd,nrep), where N is a vector/list of sample sizes, B is the true slope, A is the true intercept, sd is the true standard deviation of the residuals, and nrep is the number of simulation replicates. The function should conduct simulations and then produce a plot of statistical power versus the sample sizes in N for the hypothesis test of whether the slope is different than zero. B and A can be vectors/lists of equal length. In this case, the plot should have separate lines for each pair of A and B values (A[1] with B[1], A[2] with B[2], etc). The function should produce an informative error message if A and B are not the same length. It should also give an informative error message if N only has a single value. Demonstrate your function with some sample plots. Find some cases where power varies from close to zero to near…arrow_forwardThe value y (in 1982-1984 dollars) of each dollar paid by consumers in each of the years from 1994 through 2008 in a country is represented by the ordered pairs. (1994, 0.676) (1996, 0.638) (1998, 0.608) (2000, 0.584) (2002, 0.556) (2004, 0.528) (2006, 0.494) (2008, 0.461) (1995, 0.658) (1997, 0.622) (1999, 0.599) (2001, 0.568) (2003, 0.543) (2005, 0.509) (2007, 0.486) (a) Use a spreadsheet software program to generate a scatter plot of the data. Let t = 4 represent 1994. Do the data appear linear? O Yes No (b) Use the regression feature of the spreadsheet software program to find a linear model for the data. (Let t represent time. Round your numerical values to four decimal places.) y 3= (c) Use the model to predict the value (in 1982-1984 dollars) of 1 dollar paid by consumers in 2010 and in 2013. (Round your answers to two decimal places.) 2010 2013 24 Discuss the reliability of your predictions based on your scatter plot and the graph of your linear model for the data. Because the…arrow_forward
- Use R programming to solve the questions and include the pictures of the codes thanksarrow_forwardhow does different values of λ affects the forecasted results in a double exponential smoothing methodarrow_forwardYou are given the true labels and the predicted probabilities from logistic regression model for N test examples. Approximately compute the AUC scores for ROC and PR curves.arrow_forward
- Fit the data in the following table to the exponential model, y = cje2! using linearization. Find c, and c2 to the fourth place after the decimal point. y -2 -1 1 1 2 1/2arrow_forwardChoose an option for each of the 4 pointsarrow_forwardAssume the following simple regression model, Y = β0 + β1X + ϵ ϵ ∼ N(0, σ^2 ) Now run the following R-code to generate values of σ^2 = sig2, β1 = beta1 and β0 = beta0. Simulate the parameters using the following codes: Code: # Simulation ## set.seed("12345") beta0 <- rnorm(1, mean = 0, sd = 1) ## The true beta0 beta1 <- runif(n = 1, min = 1, max = 3) ## The true beta1 sig2 <- rchisq(n = 1, df = 25) ## The true value of the error variance sigmaˆ2 ## Multiple simulation will require loops ## nsample <- 10 ## Sample size n.sim <- 100 ## The number of simulations sigX <- 0.2 ## The variances of X # # Simulate the predictor variable ## X <- rnorm(nsample, mean = 0, sd = sqrt(sigX)) Q1 Fix the sample size nsample = 10 . Here, the values of X are fixed. You just need to generate ϵ and Y . Execute 100 simulations (i.e., n.sim = 100). For each simulation, estimate the regression coefficients (β0, β1) and the error variance (σ 2 ). Calculate the mean of…arrow_forward
- Three disease-carrying organisms decay exponentially in seawater according to the following model: Using numerical methods, estimate the initial concentration (at t=0) of each organism (A,B, and C) using multiple linear regression given the following measurements (Hint: Linearize the said equation first before proceeding using the transformation at Figure 4.5)arrow_forwardYou perform experiments and determine the following values of heat capacity c at various temperatures T for a gas: T (in deg C) Cp (in J/Kg-K) 1256.00 1300.00 1398.00 1494.00 1587.00 1730.00 |-41.000 -16.000 10.000 47.000 95.000 113.000 1) Show the linear regression formulation to determine a model to predict Cp as a function of T, i.e., Cp = c + m T 2) Write a Matlab-code to computer the slope (m) and intersect (value of c). 3) For the above data-set, select all the correct choices for the least-squares regression line is. Choices Intercept, c=1292.81 O slope, m= 2.88 Oslope, m=3.46 Intercept, c= 1360.85arrow_forwardWhat is the mean of Linear Correlation ? if r = 0 has strong linear correlation it does mean has strong linear relationship?arrow_forward
arrow_back_ios
arrow_forward_ios
Recommended textbooks for you
- Database System ConceptsComputer ScienceISBN:9780078022159Author:Abraham Silberschatz Professor, Henry F. Korth, S. SudarshanPublisher:McGraw-Hill Education
 Starting Out with Python (4th Edition)Computer ScienceISBN:9780134444321Author:Tony GaddisPublisher:PEARSON
 Digital Fundamentals (11th Edition)Computer ScienceISBN:9780132737968Author:Thomas L. FloydPublisher:PEARSON
  C How to Program (8th Edition)Computer ScienceISBN:9780133976892Author:Paul J. Deitel, Harvey DeitelPublisher:PEARSON
 Database Systems: Design, Implementation, & Manag...Computer ScienceISBN:9781337627900Author:Carlos Coronel, Steven MorrisPublisher:Cengage Learning
 Programmable Logic ControllersComputer ScienceISBN:9780073373843Author:Frank D. PetruzellaPublisher:McGraw-Hill Education
Database System Concepts
Computer Science
ISBN:9780078022159
Author:Abraham Silberschatz Professor, Henry F. Korth, S. Sudarshan
Publisher:McGraw-Hill Education
Starting Out with Python (4th Edition)
Computer Science
ISBN:9780134444321
Author:Tony Gaddis
Publisher:PEARSON
Digital Fundamentals (11th Edition)
Computer Science
ISBN:9780132737968
Author:Thomas L. Floyd
Publisher:PEARSON
C How to Program (8th Edition)
Computer Science
ISBN:9780133976892
Author:Paul J. Deitel, Harvey Deitel
Publisher:PEARSON
Database Systems: Design, Implementation, & Manag...
Computer Science
ISBN:9781337627900
Author:Carlos Coronel, Steven Morris
Publisher:Cengage Learning
Programmable Logic Controllers
Computer Science
ISBN:9780073373843
Author:Frank D. Petruzella
Publisher:McGraw-Hill Education