MATLAB: An Introduction with Applications
6th Edition
ISBN: 9781119256830
Author: Amos Gilat
Publisher: John Wiley & Sons Inc
expand_more
expand_more
format_list_bulleted
Question
thumb_up100%

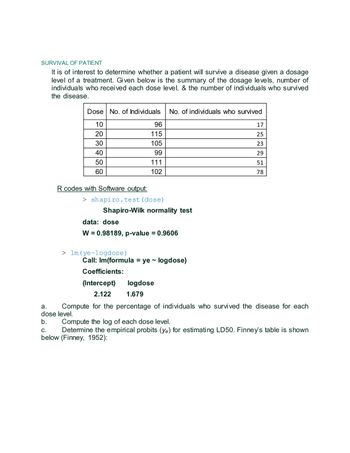
Transcribed Image Text:SURVIVAL OF PATIENT
It is of interest to determine whether a patient will survive a disease given a dosage
level of a treatment. Given below is the summary of the dosage levels, number of
individuals who received each dose level, & the number of individuals who survived
the disease.
Dose No. of Individuals
10
20
30
40
50
60
R codes with Software output:
SA No. of individuals who survived
> shapiro.test (dose)
96
115
105
99
111
102
Shapiro-Wilk normality test
> lm (ye~logdose)
data: dose
W = 0.98189, p-value = 0.9606
Coefficients:
(Intercept)
2.122
Call: Im(formula = ye~ logdose)
17
25
23
29
51
78
logdose
1.679
a.
Compute for the percentage of individuals who survived the disease for each
dose level.
b.
Compute the log of each dose level.
C.
Determine the empirical probits (ye) for estimating LD50. Finney's table is shown
below (Finney, 1952):

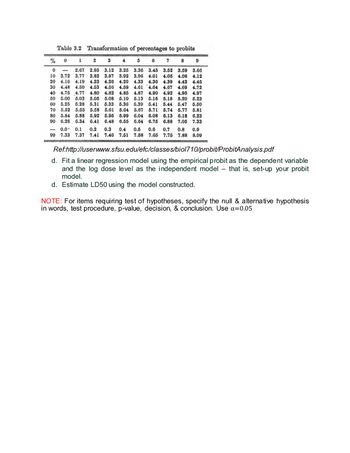
Transcribed Image Text:Table 3.2
Transformation of percentages to probits
1
2
3
4
5
6 7 8 9
% 0
0
2.67 2.95
3.12 3.25
3.52 3.59 3.66
10 3.72
3.77 3.82
3.87 3.92
4.05 4.08 4.12
4.26 4.29
40
3.36 3.45
3.96 4.01
20 4.16 4.19 4.23
4.33 4.36 4.39 4.42 4.45
30 4.48 4.50 4.53 4.50 4.59 4.61 4.64 4.67 4.69 4.72
4.75 4.77 4.80 4.82 4.85 4.87 4.90 4.92 4.95 4.97
50
5.00 5.03 5.05 5.08 5.10 5.13 5.15 5.18 5.20 5.23
60 5.25 5.28 5.31 5.33 5.36 5.39 5.41 5.44 5.47 5.50
70 5.52 5.55 5.58 5.61 5.64 5.67 5.71 5.74 5.77 5.81
80 5.84 5.88 5.92 5.95 5.99 6.04 6.08 6.13 6.18 6.23
90 6.28 6.34 6.41 6.48 6.55 6.64 6.75 6.88 7.05 7.33
0.0 0.1 0.2 0.3 0.4 0.5 0.6 0.7 0.8 0.9
99 7.33 7.37 7.41 7.40 7.51 7.58 7.65 7.75 7.88 8.09
Ref:http://userwww.sfsu.edu/efc/classes/biol710/probit/ProbitAnalysis.pdf
d. Fit a linear regression model using the empirical probit as the dependent variable
and the log dose level as the independent model - that is, set-up your probit
model.
d. Estimate LD50 using the model constructed.
NOTE: For items requiring test of hypotheses, specify the null & alternative hypothesis
in words, test procedure, p-value, decision, & conclusion. Use α=0.05
Expert Solution
This question has been solved!
Explore an expertly crafted, step-by-step solution for a thorough understanding of key concepts.
Step by stepSolved in 6 steps with 1 images

Follow-up Questions
Read through expert solutions to related follow-up questions below.
Follow-up Question
Fit a linear regression model using the empirical probit as the dependent variable and the log dose level as the independent model – that is, set-up your probit model. What would be the visual Linear regression Models of c and d.
Solution
by Bartleby Expert
Knowledge Booster
Similar questions
- Estimate sensitivity, specificity, positive predictive value, negative predictive value and prevalence from data in the 2 x 2 table for an infectious disease and its diagnostic test.arrow_forwardData was collected for 161 randomly selected 10 minute intervals. For each ten-minute interval, the number of people entering the atrium of a large mall were recorded. The data is summarized in the table below. Number of Guests Frequency 220 – 239 5 240 – 259 35 260 – 279 80 280 – 299 27 300 – 319 14 What is the class width for this GFDT?Class width =arrow_forwardEstimate sensitivity, specificity, positive predictive value, negative predictive value and prevalence from data in the 2 x 2 table for an infectious disease and its diagnostic test.arrow_forward
- Researchers wondered whether the size of a person's brain was related to the individual's mental capacity. They selected a sample of 5 females and 5 males and measured their MRI image pixel counts and IQ scores. Females Males MRI IQ MRI IG The data is reported to the right. Complete parts (a) through (d) below 139 858,472 140 955,003 935,494 924,059 1.079.550 1,001.121 Click the icon to view the critical values table. 991,305 138 141 857,782 833,868 790,619 133 135 132 141 135 140 AMRI 1,080,000- AIO 145 AIO 145- AMRI 1,080,000 780,000 130 130 780,000 130 780,000 780,000 130 1,080,000 145 1,080,000 MRI 145 MRI (b) Compute the linear correlation coefficient between MRI count and IQ. Are MRI count and IQ linearly related? Select the correct choice below and, if necessary, fill in the answer box to complete your choice. (Round to three decimal places as needed.) A. Yes, MRI count and IQ are linearly related since the linear correlation coefficient is O B. No. MRI count and IQ are not…arrow_forwardUse the data on student load. to test the claim that mean student load is more than 6.5 units. Use α = 0.10. Assume all requirements have been met. Student Unit Load 3, 12, 6, 9, 6, 12, 15, 12, 7, 9, 3 Test the claim that mean student load is more than 6.5 units. Use α = 0.10. Assume all requirements have been met.arrow_forwardNeed help. Will give thumbs up! Data typed below. Thank you! TSERofReturn AcmeRofReturn -1.99167 -1.03712 2.64815 3.04528 -0.58856 0.44802 -0.76395 0.60781 -0.81178 2.51735 -0.14212 1.70972 0.17677 -0.27609 0.54349 1.18672 -0.09428 0.49632 0.3681 -3.08347 0.60727 1.4182 1.3726 0.1878 -0.8915 -1.81699 1.8031 0.975 -0.26967 1.85853 2.42493 2.33005 -0.95528 -0.48742 -0.28562 -0.15591 -2.13517 -1.67924 -0.85961 1.57905 1.0856 -4.09194 -1.06689 -0.43368 0.04922 1.22281 3.2381 -0.55675 1.05371 -0.23124 -1.1785 -5.10525 1.11749 0.5909 -0.01456 1.70857 1.13344 0.93883 2.6641 0.92507 -1.33795 0.9294 -1.65683 -1.93668 -2.21489 -5.10648 -1.19445 0.47456 -0.461 0.19373 0.6551 -0.44915 1.5161 -1.11084 3.42943 2.58471 -0.3175 1.17337 -0.47695 -1.08238…arrow_forward
- File Edit View History Home - myRCC Frequency mylearning.suny.edu/d21/le/content/920969/viewContent/25846458/View -10 8 n= Data was collected for a sample of organic snacks. The amount of sugar (in mg) in each snack is summarized in the histogram below. 6 X 2 Bookmarks Profiles Tab Window Help A.1 HW-23FA STATISTICS (81 X 160 164 168 172 176 180 184 188 amount of sugar (mg) Q What is the sample size for this data set? Submit Question Question Help: Video b Enter your payment details | ba x + BUN SEP 15 MacBook Airarrow_forwardPlease find test statistic and p value also thank youarrow_forwardX, absences Y, final grade 4. The data below are the number of absences, x, and the final grades, y, of 9 randomly selected students from a MTH 119 class. Construct a scatterplot of the data. 0 99 4 58 7 51 5 82 9 71 geyerinstructional.com 3 92 16 55 1 5 76 5 82arrow_forward
arrow_back_ios
arrow_forward_ios
Recommended textbooks for you
 MATLAB: An Introduction with ApplicationsStatisticsISBN:9781119256830Author:Amos GilatPublisher:John Wiley & Sons Inc
 Probability and Statistics for Engineering and th...StatisticsISBN:9781305251809Author:Jay L. DevorePublisher:Cengage Learning
 Statistics for The Behavioral Sciences (MindTap C...StatisticsISBN:9781305504912Author:Frederick J Gravetter, Larry B. WallnauPublisher:Cengage Learning
 Elementary Statistics: Picturing the World (7th E...StatisticsISBN:9780134683416Author:Ron Larson, Betsy FarberPublisher:PEARSON
 The Basic Practice of StatisticsStatisticsISBN:9781319042578Author:David S. Moore, William I. Notz, Michael A. FlignerPublisher:W. H. Freeman
 Introduction to the Practice of StatisticsStatisticsISBN:9781319013387Author:David S. Moore, George P. McCabe, Bruce A. CraigPublisher:W. H. Freeman

MATLAB: An Introduction with Applications
Statistics
ISBN:9781119256830
Author:Amos Gilat
Publisher:John Wiley & Sons Inc

Probability and Statistics for Engineering and th...
Statistics
ISBN:9781305251809
Author:Jay L. Devore
Publisher:Cengage Learning

Statistics for The Behavioral Sciences (MindTap C...
Statistics
ISBN:9781305504912
Author:Frederick J Gravetter, Larry B. Wallnau
Publisher:Cengage Learning

Elementary Statistics: Picturing the World (7th E...
Statistics
ISBN:9780134683416
Author:Ron Larson, Betsy Farber
Publisher:PEARSON

The Basic Practice of Statistics
Statistics
ISBN:9781319042578
Author:David S. Moore, William I. Notz, Michael A. Fligner
Publisher:W. H. Freeman

Introduction to the Practice of Statistics
Statistics
ISBN:9781319013387
Author:David S. Moore, George P. McCabe, Bruce A. Craig
Publisher:W. H. Freeman