Related questions
Question
First define, then use maps to discuss the following events: a) tornado, b) severe thunderstorms and c) severe hail
i) the frequency of occurrence (days per year) and distribution (where in the US each event occurs the most, the least, and average days per year) and
ii) The reasons for specific events to occur the most at or around those areas (discuss in terms of the ingredients to form a weather event and how the area favorably works for those ingredients).

Transcribed Image Text:1422 2016 16 1313 15 16 1 131214 1311 12 15 18 56 92 INA
29 2 2 1436 6 65 8(1 12 15 12 14 9 2 4 lo 11
122 411421 14 11 oil13 13 10 11 14 18 14 N DS
123111 21 2N 457 09 n pa
122232121365 sy5 7
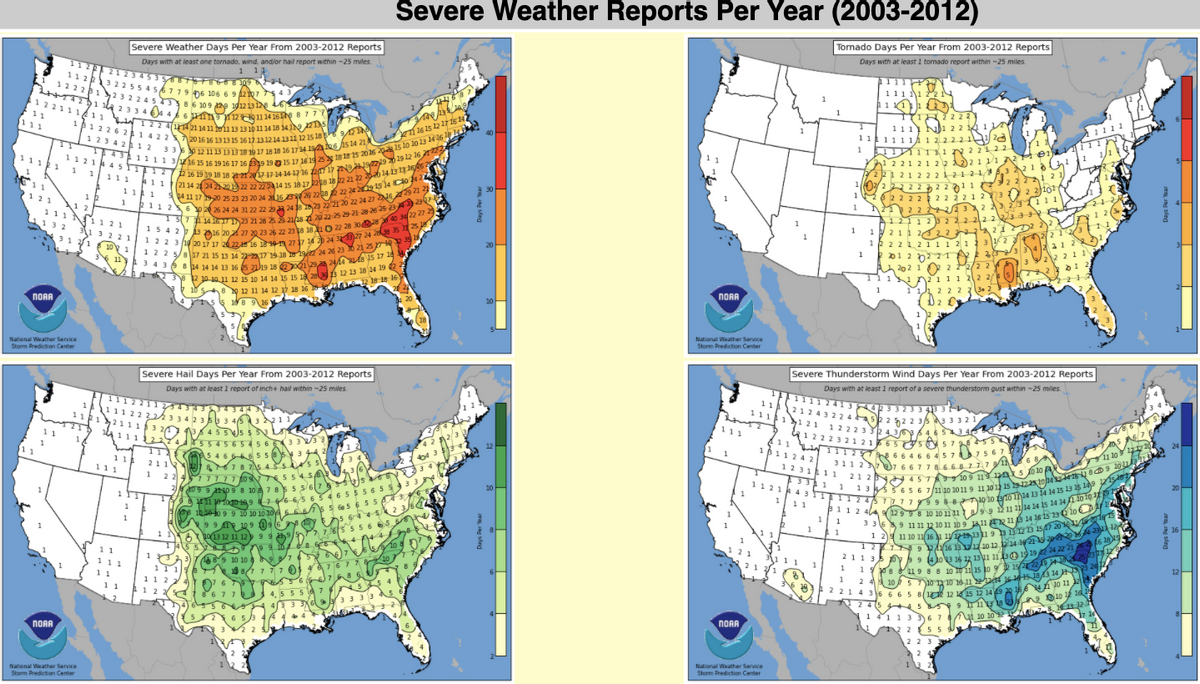
Severe Weather Reports Per Year (2003-2012)
343 6 84 14 14 13 16 s 2119 18 201 29 244 15 17 14
33 0 12 1l13 13 13 18 1917 18 18 16 1714 19A6 As 14 21
Severe Weather Days Per Year From 2003-2012 Reports
Tomado Days Per Year From 2003-2012 Reports
Days with at least one tornado, wind, and/or hail report within -25 miles.
11
Days with at least 1 tomado report within -25 miles.
1
1111
255456719 n6 106 69 27
23224543
22
111 1
1221
1 la 233 4 64 4
4386 109 ag 101213 e L6
11
111
12262 1422
123.
111 Ni 2 2 14 1
12222 1 23
IT1 N 22122
111
2342h1 2
e 16 15 121715 14
11
120 16 16 131315 1617 131214 1311 12 15 18s 2 1
1111
221 21 2 2 2 1 11 2He
212221 21216,3 221
11121
1
111
1 1
111
11
9 26 24 24 31 22 22 2a 24 a 221 20 22 24 27 2N 2
D2 21 28 5š2/18 a 20 225 29 21 20-26İS A
22 2222 ž2123 0 2 210t
2 2 3111
1271 23 2222 2 a
1 21
1P22 12111212 3 2
1
12
1 2
1
111
13 2
121
1
3221
2/213
101
11
342a 1 2
22 2
20
20 2 1 2 2/2 2
11122 2/
11 2 2 2 3
U2 £
a 10 11 12 15 10 14 14 15 15 18 28d 12 13 18 14 19 e
NOAA
NOAA
108 916
20
10
National Weather Service
National Weather Service
Storm Prediction Center
Storm Prediction Center
Severe Hail Days Per Year From 2003-2012 Reports
Severe Thunderstorm Wind Days Per Year From 2003-2012 Reports
Days with at least 1 report of inch+ hail within -25 miles.
Days with at least 1 report of a severe thunderstorm gust within -25 miles.
म
11111 21
3AR3323
1121
22334 23 53 3 4 31 1
4 52 25 22 353 3 321
12223 32 4.366 465
655 s 7
111
4555 5 3
74
k122
11
111242
12/3
6/7
554565456633/3
A5 4 65-66558s 3442
7 8 7s 4s's 5 3
11177 fo E 55 45 U
d09 9 p 98 10 78S5 567
11
e 66 4 6 6 457 7567
21
1 224
3112 7 667 7 8.6.681171
11
111
16
12
1121k4
DO 4 5T 1o9 1 12a5 0 10 A
1 13 65 6 7 /m10 10119 11101 15
124127 9 10 10
e112 4la s12 8 10 10 1i l1 |
10
20
5 6- s 2 3
99 109 (09
o13 12 11 12 99 9
79 9 18.
8/7
1211 10 1116 u 1 u nB 1547 20
1 9 vA16 u10 1214 21 9
1.
2 16E
765 5 56 65
11
là9 10 10
1 1 s u9 88 10 15 10 9 152
2 4 10
221 4 36 6 65 8(1 12 15 12 14 97
10 8/1 17 7
12
1
6 77
4.555à 7
5 la 10 2 16
4.
NORA
NOAA
2 (55
22 3
National Weather Service
National Weather Service
1
Storm Prediction Center
Storm Prediction Center

Transcribed Image Text:These maps were created by gridding the total number of daily severe weather reports (Midnight to 11:59pm CDT) over the 10-year period from 2003
through 2012 on a 80km grid. The resulting grid numbers are then divided by 10 and smoothed to arrive at the annual average number of days with a
report of severe weather based on official NWS Storm Data records. The 80km grid-point value corresponds to the number of events within 25 miles of a
point. While the resulting maps generally match our understanding of severe weather climatology, there are a few exceptions that come about as a result
of how the severe weather event is quantified. Even through the data are smoothed, severe weather reports cluster around population centers. This can
be seen on the "any" or "all" severe weather map in the upper left. Maximum values show up around Charlotte, NC, Huntsville, AL, Jackson, MS,
Springfield, MO, and Dallas, TX. These are locations where more severe weather is reported because more people live in those areas. The hail reports
used to generate the hail frequency map are from reports of hail 1 inch or greater in diameter. Large hail reports are most common from Rapid City, SD to
Denver, CO, Dodge City, KS, and Springfield, MO. The wind report map perhaps poses the greatest challenge in terms of representing where a greater
severe thunderstorm wind threat may exist. The majority of severe thunderstorm wind reports are verified by falling trees "not* by observed wind gusts of
50 knots or greater. Thus, there is a distinct tendency for severe thunderstorm winds to be reported in areas with more trees. Recent peer-reviewed
studies have compared the severe weather reports used to make these maps with automated observations (for wind), and radar data (for hail). These
studies have found that greater concentrations/frequencies of severe hail (based on radar) and 50kt or greater severe thunderstorm wind gusts (based on
automated observations) are more likely to occur over parts of the Great Plains and Midwest than what might be indicated in the maps shown here. (Click
each map for full resolution version.)
Expert Solution
This question has been solved!
Explore an expertly crafted, step-by-step solution for a thorough understanding of key concepts.

Step by stepSolved in 2 steps
