MATLAB: An Introduction with Applications
6th Edition
ISBN: 9781119256830
Author: Amos Gilat
Publisher: John Wiley & Sons Inc
expand_more
expand_more
format_list_bulleted
Question
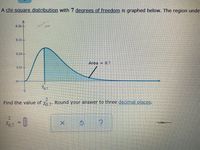
A chi-square distribution with 7 degrees of freedom is a graphed below. The region under the curve to the right of x2-0.7 is shaded. The area of this region is 0.7.

Transcribed Image Text:A chi-square distribution with 7 degrees of freedom is graphed below. The region unde
0.20-
0.15-
0.10-
Area = 0.7
0.05+
2.
Find the value of y7. Round your answer to three decimal places.
2.
%0.7
- 0
の

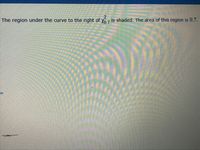
Transcribed Image Text:The region under the curve to the right of Y7 is shaded. The area of this region is 0.7.
Expert Solution
This question has been solved!
Explore an expertly crafted, step-by-step solution for a thorough understanding of key concepts.
Step by stepSolved in 2 steps

Knowledge Booster
Similar questions
- Find the z-score that has 64.1% of the distribution's area to its right. The z-score is. (Round to two decimal places as needed.)arrow_forwardDetermine the t-value in each of the cases. Click the icon to view the table of areas under the t-distribution. ..... (a) Find the t-value such that the area in the right tail is 0.025 with 11 degrees of freedom. (Round to three decimal places as needed.) (b) Find the t-value such that the area in the right tail is 0.01 with 24 degrees of freedom. (Round to three decimal places as needed.) (c) Find the t-value such that the area left of the t-value is 0.005 with 28 degrees of freedom. [Hint: Use symmetry.] (Round to three decimal places as needed.) (d) Find the critical t-value that corresponds to 70% confidence. Assume 29 degrees of freedom. (Round to three decimal places as needed.)arrow_forwardFind the area of the shaded region. The graph to the right depicts IQ scores of adults, and those scores are normally distributed with a mean of 100 and a standard deviation of 15. 97 A symmetric bell-shaped curve is plotted over a horizontal scale. A vertical line runs from the scale to the curve at labeled coordinate 97, which is to the left of the curve’s center and peak. The area under the curve to the right of the vertical line is shaded. Question content area bottom Part 1 The area of the shaded region is enter your response here. (Round to four decimal places as needed.)arrow_forward
arrow_back_ios
arrow_forward_ios
Recommended textbooks for you
 MATLAB: An Introduction with ApplicationsStatisticsISBN:9781119256830Author:Amos GilatPublisher:John Wiley & Sons Inc
 Probability and Statistics for Engineering and th...StatisticsISBN:9781305251809Author:Jay L. DevorePublisher:Cengage Learning
 Statistics for The Behavioral Sciences (MindTap C...StatisticsISBN:9781305504912Author:Frederick J Gravetter, Larry B. WallnauPublisher:Cengage Learning
 Elementary Statistics: Picturing the World (7th E...StatisticsISBN:9780134683416Author:Ron Larson, Betsy FarberPublisher:PEARSON
 The Basic Practice of StatisticsStatisticsISBN:9781319042578Author:David S. Moore, William I. Notz, Michael A. FlignerPublisher:W. H. Freeman
 Introduction to the Practice of StatisticsStatisticsISBN:9781319013387Author:David S. Moore, George P. McCabe, Bruce A. CraigPublisher:W. H. Freeman

MATLAB: An Introduction with Applications
Statistics
ISBN:9781119256830
Author:Amos Gilat
Publisher:John Wiley & Sons Inc

Probability and Statistics for Engineering and th...
Statistics
ISBN:9781305251809
Author:Jay L. Devore
Publisher:Cengage Learning

Statistics for The Behavioral Sciences (MindTap C...
Statistics
ISBN:9781305504912
Author:Frederick J Gravetter, Larry B. Wallnau
Publisher:Cengage Learning

Elementary Statistics: Picturing the World (7th E...
Statistics
ISBN:9780134683416
Author:Ron Larson, Betsy Farber
Publisher:PEARSON

The Basic Practice of Statistics
Statistics
ISBN:9781319042578
Author:David S. Moore, William I. Notz, Michael A. Fligner
Publisher:W. H. Freeman

Introduction to the Practice of Statistics
Statistics
ISBN:9781319013387
Author:David S. Moore, George P. McCabe, Bruce A. Craig
Publisher:W. H. Freeman