Elementary Geometry For College Students, 7e
7th Edition
ISBN: 9781337614085
Author: Alexander, Daniel C.; Koeberlein, Geralyn M.
Publisher: Cengage,
expand_more
expand_more
format_list_bulleted
Question
thumb_up100%
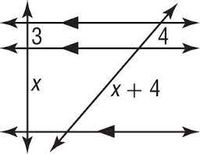
Find the value of x in the diagram below

Transcribed Image Text:x+4
Expert Solution
This question has been solved!
Explore an expertly crafted, step-by-step solution for a thorough understanding of key concepts.
Step by stepSolved in 2 steps with 8 images

Knowledge Booster
Similar questions
- The mapping diagrams below show 4 different relationships between input and output values. How many of the mapping diagrams represent functions? Input Output Input Output 1. 9- 2 2- 4 3- 8- 4 6- 8. Input Output Input Output -8 -2 3. 3. 7 6. 2 1arrow_forwardHelp.explain.arrow_forwardlet R be the relation on the set A = {1, 2, 3, 4, 5, 6} defined by a R bif and only if a = 2b.arrow_forward
- Identify the following relation (refer to the image) if it function or not.arrow_forwardMatch these values of r with the accompanying scatterplots: 1, -0.355, -0.718, 0.355, and 0.996. Scatterplot 1 Scatterplot 2 8- 6- 6- FUUS 4- 2-* 0- 0 0.2 0.4 0.6 0.8 1 X 4- 2- 0- 0 0.2 0.4 0.6 0.8 X > 15- 14- 13- 12- 11- Scatterplot 3 10+ . 0 0.2 0.4 0.6 0.8 X O A. Scatterplot 1, r=-0.355; Scatterplot 2, r = 1, Scatterplot 3, r = 0.355, Scatterplot 4, r = -0.718, Scatterplot 5, r = 0.996 B. Scatterplot 1, r = 0.355; Scatterplot 2, r = 0.996, Scatterplot 3, r = -0.355, Scatterplot 4, r = -0.718, Scatterplot 5, r = 1 O C. Scatterplot 1, r=-0.355; Scatterplot 2, r = 0.996, Scatterplot 3, r = 0.355, Scatterplot 4, r = -0.718, Scatterplot 5, r = 1 O D. Scatterplot 1, r= 0.355; Scatterplot 2, r = 1, Scatterplot 3, r = -0.355, Scatterplot 4, r = -0.718, Scatterplot 5, r = 0.996 8- 6- 4- 2- Scatterplot 4 0- 0 0.2 0.4 0.6 0.8 X 8- 6- 4- 2- 04 0 Scatterplot 5 . • 0.2 0.4 0.6 0.8 X ..arrow_forwardwhich relation does the table of values represent? X y -1 1 3. 1 1 3 2 9. 3 27arrow_forward
- · Graph. x 2 - 2 2x + y < 3arrow_forwardEvaluate each function What is f(-2)?arrow_forwardorquest.ca/mod/quiz/attempt.php?attempt3D2087476&cmid%3D1796847&page 4 This graph represents a linear relation. Determine the value of y when x = 1. of -8 6- 4. 4. .B Select one: a. 1.5 b. 1 C. 2 0d. 0.5arrow_forward
arrow_back_ios
arrow_forward_ios
Recommended textbooks for you
 Elementary Geometry For College Students, 7eGeometryISBN:9781337614085Author:Alexander, Daniel C.; Koeberlein, Geralyn M.Publisher:Cengage,
 Elementary Geometry for College StudentsGeometryISBN:9781285195698Author:Daniel C. Alexander, Geralyn M. KoeberleinPublisher:Cengage Learning

Elementary Geometry For College Students, 7e
Geometry
ISBN:9781337614085
Author:Alexander, Daniel C.; Koeberlein, Geralyn M.
Publisher:Cengage,

Elementary Geometry for College Students
Geometry
ISBN:9781285195698
Author:Daniel C. Alexander, Geralyn M. Koeberlein
Publisher:Cengage Learning