MATLAB: An Introduction with Applications
6th Edition
ISBN: 9781119256830
Author: Amos Gilat
Publisher: John Wiley & Sons Inc
expand_more
expand_more
format_list_bulleted
Question

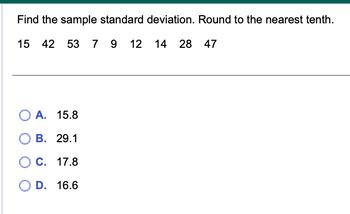
Transcribed Image Text:Find the sample standard deviation. Round to the nearest tenth.
15 42 53 7 9 12 14 28 47
O A. 15.8
B. 29.1
C. 17.8
D. 16.6
Expert Solution
This question has been solved!
Explore an expertly crafted, step-by-step solution for a thorough understanding of key concepts.
This is a popular solution
Trending nowThis is a popular solution!
Step by stepSolved in 3 steps with 1 images

Knowledge Booster
Similar questions
- solve part 2 and 4arrow_forwardsubject :- Accountarrow_forwardAssume that a randomly selected subject is given a bone density test. Bone density test scores are normally distributed with a mean of 0 and a standard deviation of 1. Draw a graph and find P, the 11th percentile. This is the bone density score separating the bottom 11% from the top 89%. Which graph represents P ? Choose the correct graph below. O A. O B. OD. P11 P11 P11 P11 The bone density score corresponding to P1 is (Round to two decimal places as needed.) Click to select your answer(s). APR tv MacBook Air F9 F10 LLA 20 F3 F6 F8 F4 F5 F1 F2 & #3 7 8. %24arrow_forward
- Part d, e and farrow_forwardThis lést: 14 pts possiE Question Help Four siblings are 1, 3, 8, and 9 years of age. Complete parts (a) through (e) below. (Round to the nearest tenth as needed.) d. Without doing any calculation, indicate whether the standard deviation of the ages in 15 years will be larger, smaller, or the same as the standard deviation of their current ages. Choose the correct answer below. O A. The standard deviation will be larger. O B. The standard deviation will be smaller. O C. The standard deviation will be the same. O D. The standard deviation cannot be approximated without calculations. Check your answer by calculating the standard deviation in 15 years. years (Round to the nearest tenth as needed.) e. Adding 15 years to each of the siblings' ages had different effects on the mean and the standard deviation. Why did one of these values change while the other remained unchanged? How does adding the same value to each number in a data set affect the mean and standard deviation? Choose the…arrow_forward28 The scores on a mathematics exam have a mean of 66 and a standard deviation of 6. Find the x-value that corresponds to the z-score −2.33. Round the answer to the nearest tenth. A. 63.7 B. 80.0 C. 52.0 D. 60.0arrow_forward
- Part d, e and f pleasearrow_forwardGuanbary Find the range and standard deviation for the data Items In the histogram below. +5 4. 3. Data Round the standard devlation to two decimal places if needed. The standard devlation is Submit Questlon Finat for PSY101..pptx BL 9.arrow_forward80 84 94 65 72 55 84 99 86 87 For this population answer the following 6 questions. 1. Find U=. 2. Find O - %3D 3. Find the standard deviation = 4. Find the Z-score of 75. 5. How many standard deviations from the mean is the score of 62? 6. What score represents a Z-score of -2 for this popuiation? shows thos vearrow_forward
arrow_back_ios
arrow_forward_ios
Recommended textbooks for you
 MATLAB: An Introduction with ApplicationsStatisticsISBN:9781119256830Author:Amos GilatPublisher:John Wiley & Sons Inc
 Probability and Statistics for Engineering and th...StatisticsISBN:9781305251809Author:Jay L. DevorePublisher:Cengage Learning
 Statistics for The Behavioral Sciences (MindTap C...StatisticsISBN:9781305504912Author:Frederick J Gravetter, Larry B. WallnauPublisher:Cengage Learning
 Elementary Statistics: Picturing the World (7th E...StatisticsISBN:9780134683416Author:Ron Larson, Betsy FarberPublisher:PEARSON
 The Basic Practice of StatisticsStatisticsISBN:9781319042578Author:David S. Moore, William I. Notz, Michael A. FlignerPublisher:W. H. Freeman
 Introduction to the Practice of StatisticsStatisticsISBN:9781319013387Author:David S. Moore, George P. McCabe, Bruce A. CraigPublisher:W. H. Freeman

MATLAB: An Introduction with Applications
Statistics
ISBN:9781119256830
Author:Amos Gilat
Publisher:John Wiley & Sons Inc

Probability and Statistics for Engineering and th...
Statistics
ISBN:9781305251809
Author:Jay L. Devore
Publisher:Cengage Learning

Statistics for The Behavioral Sciences (MindTap C...
Statistics
ISBN:9781305504912
Author:Frederick J Gravetter, Larry B. Wallnau
Publisher:Cengage Learning

Elementary Statistics: Picturing the World (7th E...
Statistics
ISBN:9780134683416
Author:Ron Larson, Betsy Farber
Publisher:PEARSON

The Basic Practice of Statistics
Statistics
ISBN:9781319042578
Author:David S. Moore, William I. Notz, Michael A. Fligner
Publisher:W. H. Freeman

Introduction to the Practice of Statistics
Statistics
ISBN:9781319013387
Author:David S. Moore, George P. McCabe, Bruce A. Craig
Publisher:W. H. Freeman