
MATLAB: An Introduction with Applications
6th Edition
ISBN: 9781119256830
Author: Amos Gilat
Publisher: John Wiley & Sons Inc
expand_more
expand_more
format_list_bulleted
Related questions
Topic Video
Question
FIND THE P VALUE GIVEN THIS DATA
The total time (in minutes) a subject spent on the Trail
Making Test (a standard psychological test) was used as
a measure of cognitive
that the mean time on the Trail Making Test for schizophrenics
will be larger than the corresponding mean
for normal subjects. The data for independent random
samples of 41 schizophrenics and 49 normal individuals
yielded the following results:
***PHOTO
Does the data provide significant evidence,
at the 4.6% level, that the population mean time for patients diagnosed with schizophrenia
exceeds the population mean time for normal individuals by more than 20 points?
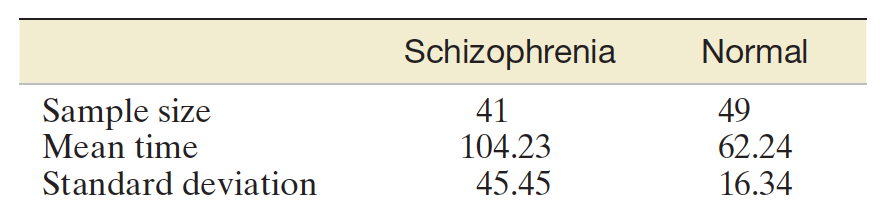

Transcribed Image Text:Schizophrenia
Normal
Sample size
Mean time
41
104.23
45.45
49
62.24
16.34
Standard deviation
Expert Solution
This question has been solved!
Explore an expertly crafted, step-by-step solution for a thorough understanding of key concepts.

This is a popular solution

Trending nowThis is a popular solution!

Step by stepSolved in 2 steps

Knowledge Booster


Learn more about
Need a deep-dive on the concept behind this application? Look no further. Learn more about this topic, statistics and related others by exploring similar questions and additional content below.Similar questions
- Find the P valuearrow_forwardBelow is a histogram summarizing the salaries of high school teachers at a high school with very few new teachers (in thousands of dollars). Histogram 9. 4 21 0. 50 60 70 80 High School Teacher Salaries 90 For the histogram shown, choose the statement that is TRUE. O The mean salary is equal to the median salary. O The mean salary is larger than the median salary. O The mode is $85,000 O The mean salary is less than the median salary. O The range is $70,000 e Type here to search L Count 40arrow_forwardThe data in the table is the number of absences for 7 students and their corresponding grade. Number of Absences Grade0 5.51 52 4.53 3.55 37 2.58 2 Step 2 of 3: Determine if r is statistically significant at the 0.01 level.arrow_forward
- Empathy among police officers influences how they interact with citizens and the likelihood that they receive complaints. Gender differences in levels of empathy in the general population are not large but male and female officers have been shown to have different interaction styles with the public; this may be due to the different empathy levels. After sampling officers and measuring their levels of empathy you find the following data. Males Females n = 6 n = 9 M = 31 M = 45 SS = 490 SS = 680 If you were going to make gender comparisons like this, which option would be the correct choice? Write A or B in the box. [a] Option A. Independent-measures t-test Option B. Repeated-measures t-testarrow_forwardANOVAA therapist is interested on investigating whether there are any significant mean differences in the treatments on stress (a score from 0 to 10) among students with anxiety. The data is recorded as below. Mindfulness Playing with puppies Watching a positive video 01010 23230 24454 What are the groups being compared? That is, what are the levels of the IV? What is the IV? What is the level of measurement of the IV? What is being measured? That is, what is the DV? What is the level of measurement of the DV? With α = .05, determine whether there are any significant mean differences among the groups. Complete steps 1-4 of the hypothesis test and write interpretations.arrow_forward4arrow_forward
- Dr. Springer collected data to see whether people who eat an all-carbohydrate meal have different scores on a mood scale than people who eat an all-protein meal. Higher scores represent better moods. Here are her results: All Carbs All Protein 10 7 8 4 7 9 9 28 13 13 7 7 12 Is there a difference in reported mood between the two groups? Use a two tailed test with an a = 0.05. Step 4: Make a decision Our test statistic has a value of t = I , and in Step 2 we found that the critical value is t* = the null hypothesis Therefore, we (write: reject or fail to reject)arrow_forwardI guessed that the relationship between the mean and the median cannot be determined. That was wrong. I do not Understand what to look for on this diagramarrow_forwardIntelligence test given to two groups of boys and girls gave the following information : Mean score S.D. Number Girls 75 10 100 Boys On the basis of the above information would you conclude that mean scores of boys and girls are statistically significant ? 70 12 200arrow_forward
- could you please help to answer this question? thank youarrow_forwardHelp!!arrow_forwardSelect all true statements below (Multiple or none can be true). With a large, representative sample, the histogram of the sample data will follow the normal curve closely. If two lists of numbers have exactly the same average of 50 and SD of 10, then the percentage of entries between 40 and 60 must be exactly the same for both lists. Half of a list of numbers is always below its average. The median and average of a list of numbers are not necessarily close together.arrow_forward
arrow_back_ios
SEE MORE QUESTIONS
arrow_forward_ios
Recommended textbooks for you
- MATLAB: An Introduction with ApplicationsStatisticsISBN:9781119256830Author:Amos GilatPublisher:John Wiley & Sons Inc
 Probability and Statistics for Engineering and th...StatisticsISBN:9781305251809Author:Jay L. DevorePublisher:Cengage Learning
 Statistics for The Behavioral Sciences (MindTap C...StatisticsISBN:9781305504912Author:Frederick J Gravetter, Larry B. WallnauPublisher:Cengage Learning
  Elementary Statistics: Picturing the World (7th E...StatisticsISBN:9780134683416Author:Ron Larson, Betsy FarberPublisher:PEARSON
 The Basic Practice of StatisticsStatisticsISBN:9781319042578Author:David S. Moore, William I. Notz, Michael A. FlignerPublisher:W. H. Freeman
 Introduction to the Practice of StatisticsStatisticsISBN:9781319013387Author:David S. Moore, George P. McCabe, Bruce A. CraigPublisher:W. H. Freeman
MATLAB: An Introduction with Applications
Statistics
ISBN:9781119256830
Author:Amos Gilat
Publisher:John Wiley & Sons Inc
Probability and Statistics for Engineering and th...
Statistics
ISBN:9781305251809
Author:Jay L. Devore
Publisher:Cengage Learning
Statistics for The Behavioral Sciences (MindTap C...
Statistics
ISBN:9781305504912
Author:Frederick J Gravetter, Larry B. Wallnau
Publisher:Cengage Learning
Elementary Statistics: Picturing the World (7th E...
Statistics
ISBN:9780134683416
Author:Ron Larson, Betsy Farber
Publisher:PEARSON
The Basic Practice of Statistics
Statistics
ISBN:9781319042578
Author:David S. Moore, William I. Notz, Michael A. Fligner
Publisher:W. H. Freeman
Introduction to the Practice of Statistics
Statistics
ISBN:9781319013387
Author:David S. Moore, George P. McCabe, Bruce A. Craig
Publisher:W. H. Freeman