MATLAB: An Introduction with Applications
6th Edition
ISBN: 9781119256830
Author: Amos Gilat
Publisher: John Wiley & Sons Inc
expand_more
expand_more
format_list_bulleted
Question

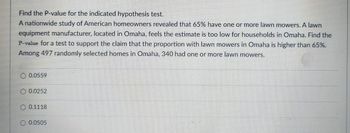
Transcribed Image Text:Find the P-value for the indicated hypothesis test.
A nationwide study of American homeowners revealed that 65% have one or more lawn mowers. A lawn
equipment manufacturer, located in Omaha, feels the estimate is too low for households in Omaha. Find the
P-value for a test to support the claim that the proportion with lawn mowers in Omaha is higher than 65%.
Among 497 randomly selected homes in Omaha, 340 had one or more lawn mowers.
0.0559
0.0252
0.1118
0.0505
Expert Solution
This question has been solved!
Explore an expertly crafted, step-by-step solution for a thorough understanding of key concepts.
This is a popular solution
Trending nowThis is a popular solution!
Step by stepSolved in 3 steps

Knowledge Booster
Similar questions
- In the Texas senate races, a candidate must clear 50% to avoid a runoff election. In a recent poll of 1040 voters in Texas, 51% of voters preferred candidate. We will a hypothesis test to see if we can say at the 5% significance level that more than 50% of voters in Texas prefer candidate based on this poll. State the null and alternative hypothesis. Find the test-statistic. Find the P-value. Make a conclusion. Interpret your answer.arrow_forwardConstruct a 95% confidence interval for p1 - p2 for a survey that finds 30% of 240 males and 41% of 200 females are opposed to the death penalty. Group of answer choices a.(-0.200, -0.021) b.(-1.532, 1.342) c.(-1.324, 1.512) d.(-0.561, 0.651)arrow_forwardPortland State University (PSU) reported that 64% of their students receive financial aid. A PSU administrator feels that their school may have a different proportion compared to all of Oregon schools. A random sample of 409 students in Oregon found that 259 receive financial aid. Test the claim that proportion of students that receive financial aid in Oregon is different than PSU. Use a 1% significance level. Give answer to at least 4 decimal places. a. What are the correct hypotheses? (Select the correct symbols and use decimal values not percentages.) Ho: Select an answer ?v H₁: Select an answer ? ✓ Based on the hypotheses, compute the following: b. Test Statistic = c. p-value = d. Based on the above we choose to Select an answer e. The correct summary would be: Select an answer that the proportion of students that receive financial aid in Oregon is different than the PSU reported value of 64%.arrow_forward
- Among a simple random sample of 331 American adults who do not have a four-year college degree and are not currently enrolled in school, 159 said they decided not to go to college because they could not afford school. A. Calculate the test statistic and the p-value. B. State the conclusion in context.arrow_forwardA college administrator is interested in determining the proportion of students who receive some sort of financial aid. Instead of examining the records for all students, the administrator randomly draws 120 students and finds that 48 of them are receiving financial aid. Use a 90% confidence interval to estimate the true proportion of students who receive financial aid.arrow_forwardA political researcher takes a survey of 310 randomly selected registered voters in Orlando, and each person was asked who they plan on voting for in the 2024 presidential election. 110 said they plan on voting for Candidate A, 185 said they plan on voting for Candidate B, and 15 were unsure or plan to vote for another candidate. The researcher wants to construct a 95% confidence interval for the proportion of all registered voters in Orlando who plan to vote for Candidate B. What is the point estimate? Round final answer to 3 decimal places.arrow_forward
arrow_back_ios
arrow_forward_ios
Recommended textbooks for you
 MATLAB: An Introduction with ApplicationsStatisticsISBN:9781119256830Author:Amos GilatPublisher:John Wiley & Sons Inc
 Probability and Statistics for Engineering and th...StatisticsISBN:9781305251809Author:Jay L. DevorePublisher:Cengage Learning
 Statistics for The Behavioral Sciences (MindTap C...StatisticsISBN:9781305504912Author:Frederick J Gravetter, Larry B. WallnauPublisher:Cengage Learning
 Elementary Statistics: Picturing the World (7th E...StatisticsISBN:9780134683416Author:Ron Larson, Betsy FarberPublisher:PEARSON
 The Basic Practice of StatisticsStatisticsISBN:9781319042578Author:David S. Moore, William I. Notz, Michael A. FlignerPublisher:W. H. Freeman
 Introduction to the Practice of StatisticsStatisticsISBN:9781319013387Author:David S. Moore, George P. McCabe, Bruce A. CraigPublisher:W. H. Freeman

MATLAB: An Introduction with Applications
Statistics
ISBN:9781119256830
Author:Amos Gilat
Publisher:John Wiley & Sons Inc

Probability and Statistics for Engineering and th...
Statistics
ISBN:9781305251809
Author:Jay L. Devore
Publisher:Cengage Learning

Statistics for The Behavioral Sciences (MindTap C...
Statistics
ISBN:9781305504912
Author:Frederick J Gravetter, Larry B. Wallnau
Publisher:Cengage Learning

Elementary Statistics: Picturing the World (7th E...
Statistics
ISBN:9780134683416
Author:Ron Larson, Betsy Farber
Publisher:PEARSON

The Basic Practice of Statistics
Statistics
ISBN:9781319042578
Author:David S. Moore, William I. Notz, Michael A. Fligner
Publisher:W. H. Freeman

Introduction to the Practice of Statistics
Statistics
ISBN:9781319013387
Author:David S. Moore, George P. McCabe, Bruce A. Craig
Publisher:W. H. Freeman