
MATLAB: An Introduction with Applications
6th Edition
ISBN: 9781119256830
Author: Amos Gilat
Publisher: John Wiley & Sons Inc
expand_more
expand_more
format_list_bulleted
Related questions
Question
thumb_up100%
18
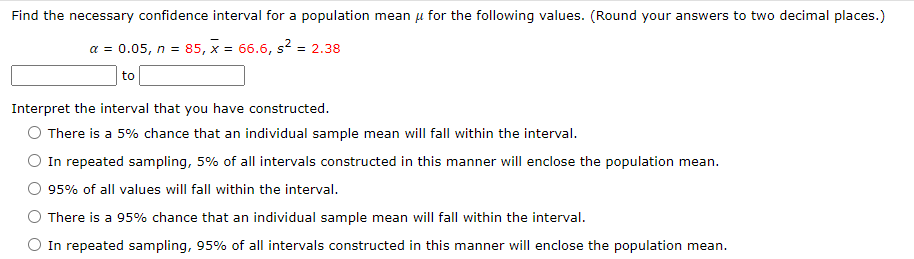

Transcribed Image Text:**Finding the Confidence Interval for a Population Mean**
In this example, we are tasked with finding the confidence interval for a population mean \( \mu \) using the given values and to interpret the interval accurately. The specific values provided are:
- Significance level (\( \alpha \)): 0.05
- Sample size (\( n \)): 85
- Sample mean (\( \bar{x} \)): 66.6
- Sample variance (\( s^2 \)): 2.38
**Steps:**
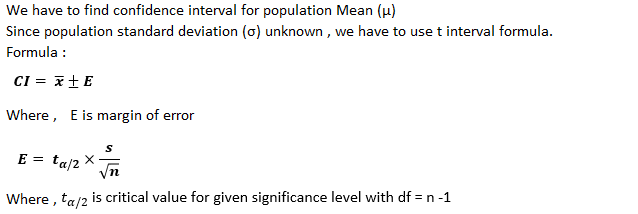
1. **Calculate the Confidence Interval:**
- Determine the confidence level, which is \( 1 - \alpha = 0.95 \) or 95%.
- Use the given sample size, mean, and variance to find the confidence interval bounds.
- Round your answers to two decimal places.
2. **Interpret the Interval:**
The correct interpretation of the constructed confidence interval should be chosen from the following options:
- There is a 5% chance that an individual sample mean will fall within the interval.
- In repeated sampling, 5% of all intervals constructed in this manner will enclose the population mean.
- 95% of all values will fall within the interval.
- There is a 95% chance that an individual sample mean will fall within the interval.
- In repeated sampling, 95% of all intervals constructed in this manner will enclose the population mean.
**Explanation:**
Confidence intervals provide a range within which we expect the true population parameter to lie. It is a reflection of statistical confidence based on sample data, without guaranteeing the parameter's location within that range for a single interval but rather across many different samples and intervals.
Expert Solution
arrow_forward
Step 1

Step by stepSolved in 2 steps with 4 images

Knowledge Booster

Similar questions
- Eye Color Based on a study by Dr. R Sorita at Indiana University, assume that 12% of us have green eyes. In a study of 650 people, it is found that 86 of them have green eyes. a. Find the probability of at least 86 people with green eyes among 650 randomly selected people. b. Is 86 people with green eyes significantly high?arrow_forward7) 16 63arrow_forward7) 60 16arrow_forward
arrow_back_ios
arrow_forward_ios
Recommended textbooks for you
- MATLAB: An Introduction with ApplicationsStatisticsISBN:9781119256830Author:Amos GilatPublisher:John Wiley & Sons Inc
 Probability and Statistics for Engineering and th...StatisticsISBN:9781305251809Author:Jay L. DevorePublisher:Cengage Learning
 Statistics for The Behavioral Sciences (MindTap C...StatisticsISBN:9781305504912Author:Frederick J Gravetter, Larry B. WallnauPublisher:Cengage Learning
  Elementary Statistics: Picturing the World (7th E...StatisticsISBN:9780134683416Author:Ron Larson, Betsy FarberPublisher:PEARSON
 The Basic Practice of StatisticsStatisticsISBN:9781319042578Author:David S. Moore, William I. Notz, Michael A. FlignerPublisher:W. H. Freeman
 Introduction to the Practice of StatisticsStatisticsISBN:9781319013387Author:David S. Moore, George P. McCabe, Bruce A. CraigPublisher:W. H. Freeman
MATLAB: An Introduction with Applications
Statistics
ISBN:9781119256830
Author:Amos Gilat
Publisher:John Wiley & Sons Inc
Probability and Statistics for Engineering and th...
Statistics
ISBN:9781305251809
Author:Jay L. Devore
Publisher:Cengage Learning
Statistics for The Behavioral Sciences (MindTap C...
Statistics
ISBN:9781305504912
Author:Frederick J Gravetter, Larry B. Wallnau
Publisher:Cengage Learning
Elementary Statistics: Picturing the World (7th E...
Statistics
ISBN:9780134683416
Author:Ron Larson, Betsy Farber
Publisher:PEARSON
The Basic Practice of Statistics
Statistics
ISBN:9781319042578
Author:David S. Moore, William I. Notz, Michael A. Fligner
Publisher:W. H. Freeman
Introduction to the Practice of Statistics
Statistics
ISBN:9781319013387
Author:David S. Moore, George P. McCabe, Bruce A. Craig
Publisher:W. H. Freeman