
MATLAB: An Introduction with Applications
6th Edition
ISBN: 9781119256830
Author: Amos Gilat
Publisher: John Wiley & Sons Inc
expand_more
expand_more
format_list_bulleted
Related questions
Concept explainers
Question
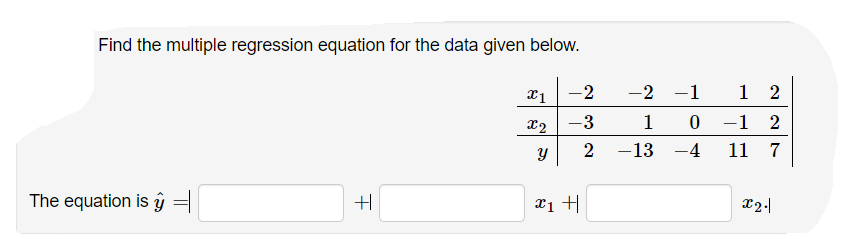

Transcribed Image Text:Find the multiple regression equation for the data given below.
-2
-2 -1
1 2
X2 -3
1
-1 2
2
-13
-4
11 7
The equation is ŷ =
Expert Solution
This question has been solved!
Explore an expertly crafted, step-by-step solution for a thorough understanding of key concepts.

This is a popular solution

Trending nowThis is a popular solution!

Step by stepSolved in 2 steps

Knowledge Booster


Learn more about
Need a deep-dive on the concept behind this application? Look no further. Learn more about this topic, statistics and related others by exploring similar questions and additional content below.Similar questions
- Suppose Ms. Carr is interested in the relationship between her students' 9th grade math final exam scores and the number of hours they spent studying during the year. She collects information for 15 ninth grade students and uses it to obtain the regression equation, where ?x is the number of hours spent studying during the year and ?̂ is the predicted final exam score. ?̂ =1.48?+75.64 The scatter plot displays her results. What is the predicted ?̂ value when a student spends 13 hours studying? Round your answer to one decimal place. Select the correct interpretation. The above predicted value of ?̂ is the predicted final math test score if a student studies 13 hours during the year. the predicted score of 13 out of 15 students. what any student will score on the final exam if they study at least 13 hours. the math final test score that 13 students beat.arrow_forwardIn order for applicants to work for the foreign-service department, they must take a test in the language of the country where they plan to work. The data below shows the relationship between the number of years that applicants have studied a particular language and the grades they received on the proficiency exam. Find the equation of the regression line for the given data. Number of years, x 4 4 3 6 2 7 3 Grades on test, y 61 68 75 82 73 90 58 93 72 滷 O A. =6.910x+46.261 O B. y = 46.261x+6.910 OC. v=6.910x-46.261 OD. O D. y = 46.261x -6.910 Fi St 5e Assigarrow_forwardA table of data points is given below. a. Find the regression equation for the data points. Use the formulas Sxx=∑ xi−x2 and Sxy=∑ xi−x yi−y to obtain Sxx and Sxy. b. Graph the regression equation and data points. x 1 2 3 y 6 5 10 a. The regression equation is y= + () x. (Simplify your answers. Type integers or decimals. Do not round.)arrow_forward
- The table shows the amounts of crude oil (in thousands of barrels per day) produced by a certain country and the amounts of crude oil (in thousands of barrels per day) imported by the same country for seven years. The equation of the regression line is y =-1.364x+17,178.20. Complete parts (a) and (b) below. Produced, x Imported, y 5,744 5,554 5,439 5,188 5,136 5,067 D 9,132 9,677 10,017 10,193 10,149 10,075 5,756 9,328 (a) Find the coefficient of determination and interpret the result. (Round to three decimal places as needed.)arrow_forwardUse the given data set to answer parts (a) and (b). a. Find the regression equation for the data points. X 5 b. Graph the regression equation and the data points. y -1 10 -10 y B. 10 -10- C. a. Find the regression equation for the data points. ŷ-0 (Use integers or decimals for any numbers in the expression. Round to two decimal places as needed.) b. Graph the regression equation and the data points. O A. 10 T -10- 1 2 -1 3 327 D. -10 4 y 4 28 0arrow_forwardThe table shows the amounts of crude oil (in thousands of barrels per day) produced by a certain country and the amounts of crude oil (in thousands of barrels per day) imported by the same country for seven years. The equation of the regression line is y = - 1.269x + 16,635.60. Complete parts (a) and (b) below. Produced, x Imported, y 5,718 5,612 5,409 5,228 5,128 5,006 O 9,106 9,631 10,000 10,140 10,133 10,059 5,759 9,318 (a) Find the coefficient of determination and interpret the result. (Round to three decimal places as needed.)arrow_forward
- Use the given data to find the equation of the regression line. Round the final values to three significant digits, if necessary.arrow_forwardn order for applicants to work for the foreign-service department, they must take a test in the language of the country where they plan to work. The data below shows the relationship between the number of years that applicants have studied a particular language and the grades they received on the proficiency exam. Find the equation of the regression line for the data. given Number of years, x 4 5 3 6 2 7 3 Grades on test, y 61 68 75 82 73 90 58 93 72 O A. y 6.910x+46.261 O B. -46.261x +6.910 O C. =6.910x-46.261 O D. = 46.261x-6.910 Next Time Remaining: 01:02:25 74°F Mostly 五 TTLarrow_forward
arrow_back_ios
arrow_forward_ios
Recommended textbooks for you
- MATLAB: An Introduction with ApplicationsStatisticsISBN:9781119256830Author:Amos GilatPublisher:John Wiley & Sons Inc
 Probability and Statistics for Engineering and th...StatisticsISBN:9781305251809Author:Jay L. DevorePublisher:Cengage Learning
 Statistics for The Behavioral Sciences (MindTap C...StatisticsISBN:9781305504912Author:Frederick J Gravetter, Larry B. WallnauPublisher:Cengage Learning
  Elementary Statistics: Picturing the World (7th E...StatisticsISBN:9780134683416Author:Ron Larson, Betsy FarberPublisher:PEARSON
 The Basic Practice of StatisticsStatisticsISBN:9781319042578Author:David S. Moore, William I. Notz, Michael A. FlignerPublisher:W. H. Freeman
 Introduction to the Practice of StatisticsStatisticsISBN:9781319013387Author:David S. Moore, George P. McCabe, Bruce A. CraigPublisher:W. H. Freeman
MATLAB: An Introduction with Applications
Statistics
ISBN:9781119256830
Author:Amos Gilat
Publisher:John Wiley & Sons Inc
Probability and Statistics for Engineering and th...
Statistics
ISBN:9781305251809
Author:Jay L. Devore
Publisher:Cengage Learning
Statistics for The Behavioral Sciences (MindTap C...
Statistics
ISBN:9781305504912
Author:Frederick J Gravetter, Larry B. Wallnau
Publisher:Cengage Learning
Elementary Statistics: Picturing the World (7th E...
Statistics
ISBN:9780134683416
Author:Ron Larson, Betsy Farber
Publisher:PEARSON
The Basic Practice of Statistics
Statistics
ISBN:9781319042578
Author:David S. Moore, William I. Notz, Michael A. Fligner
Publisher:W. H. Freeman
Introduction to the Practice of Statistics
Statistics
ISBN:9781319013387
Author:David S. Moore, George P. McCabe, Bruce A. Craig
Publisher:W. H. Freeman