
MATLAB: An Introduction with Applications
6th Edition
ISBN: 9781119256830
Author: Amos Gilat
Publisher: John Wiley & Sons Inc
expand_more
expand_more
format_list_bulleted
Related questions
Question
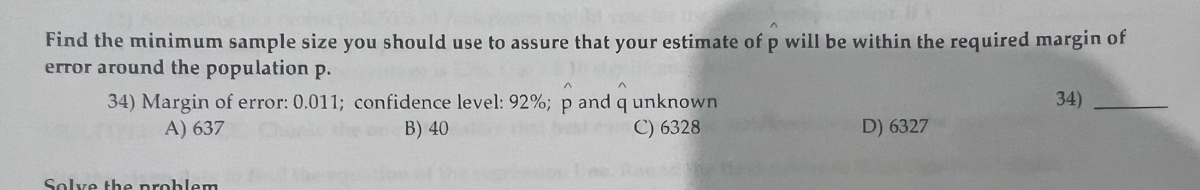

Transcribed Image Text:Find the minimum sample size you should use to assure that your estimate of p will be within the required margin of
error around the population p.
34) Margin of error: 0.011; confidence level: 92%; p and q unknown
A) 637
B) 40
C) 6328
beste
Solve the problem
D) 6327
34)
Expert Solution
This question has been solved!
Explore an expertly crafted, step-by-step solution for a thorough understanding of key concepts.

Step by stepSolved in 2 steps

Knowledge Booster

Similar questions
- Consider the set of data given below 0, 1, 2, 4, 5, 5, 7, 10, 10, 12, 13, 17, 39 A.) Find the quartiles for the above data set B) Find the IQR C)Determine if the data has any outliersarrow_forwardA sample of 49 items produced a mean of 96 and the standard deviation is 14. Test at α = 0.10 that the population mean is less than 90 using the following steps; Required: a) State the hypotheses. b) State the relevant test statistic and the reason for the selection c) Determine the Level of significance d) Apply the Decision rule e) Calculate the test statistics f) Make a conclusion based on the above stepsarrow_forwardAssume that a sample is used to estimate a population proportion p. To find the 99% confidence interval for a sample of size 382 with 141 successes, you need to use which one the following calculator O Two Independent Sample Means Comparison Given Statistics O Confidence Interval for a Population Proportion O One-Way ANOVA O Hypothesis Test for a Population Mean Given Data O Two Independent Proportions Comparison O Confidence Interval for a Population Mean Given Data O Confidence Interval for a Population Mean Given Statistics O Chi-Square Test for Goodness of Fit O Hypothesis Test for a Population Mean Given Statistics Two Independent Sample Means Comparison Given Data O Chi-Square Test for Independence O Hypothesis Test for a Population Proportion O Two Dependent Sample Means Comparison Given Data a. Enter your answer as an open-interval (i.e., parentheses) using decimals (not percents) accurate to three decimal places. Confidence interval= b. Express the same answer as a tri-linear…arrow_forward
- Construct a sample with no mode (with at least two different values in the set) of 4 measurements whose range is 14. If this is not possible, indicate "Cannot create sample".arrow_forwardUse the given dataarrow_forwardFind minimum sample size you should use to ensure that your estimate of P will be within the required margin of error around the population P a) margin of error 0.006 confidence level: 95% P and a unknown b) margin of error: 0.04;arrow_forward
- What happens to the minimum sample size needed to estimate p when the acceptable margin of error increases? O A. the minimum sample size does not change B. the minimum sample size decreases C. the minimum sample size increasesarrow_forwardonly need letter answerarrow_forwardFor a population with a mean equal to200and a standard deviation equal to 35, calculate the standard error of the mean for the following sample sizes. a) 15 b)50 c)85 Question content area bottom Part 1 a) The standard error of the mean for a sample size of 15 is (Round to two decimal places as needed.) Part 2 b) The standard error of the mean for a sample size of 50 is (Round to two decimal places as needed.) Part 3 c) The standard error of the mean for a sample size of 85 isarrow_forward
arrow_back_ios
arrow_forward_ios
Recommended textbooks for you
- MATLAB: An Introduction with ApplicationsStatisticsISBN:9781119256830Author:Amos GilatPublisher:John Wiley & Sons Inc
 Probability and Statistics for Engineering and th...StatisticsISBN:9781305251809Author:Jay L. DevorePublisher:Cengage Learning
 Statistics for The Behavioral Sciences (MindTap C...StatisticsISBN:9781305504912Author:Frederick J Gravetter, Larry B. WallnauPublisher:Cengage Learning
  Elementary Statistics: Picturing the World (7th E...StatisticsISBN:9780134683416Author:Ron Larson, Betsy FarberPublisher:PEARSON
 The Basic Practice of StatisticsStatisticsISBN:9781319042578Author:David S. Moore, William I. Notz, Michael A. FlignerPublisher:W. H. Freeman
 Introduction to the Practice of StatisticsStatisticsISBN:9781319013387Author:David S. Moore, George P. McCabe, Bruce A. CraigPublisher:W. H. Freeman
MATLAB: An Introduction with Applications
Statistics
ISBN:9781119256830
Author:Amos Gilat
Publisher:John Wiley & Sons Inc
Probability and Statistics for Engineering and th...
Statistics
ISBN:9781305251809
Author:Jay L. Devore
Publisher:Cengage Learning
Statistics for The Behavioral Sciences (MindTap C...
Statistics
ISBN:9781305504912
Author:Frederick J Gravetter, Larry B. Wallnau
Publisher:Cengage Learning
Elementary Statistics: Picturing the World (7th E...
Statistics
ISBN:9780134683416
Author:Ron Larson, Betsy Farber
Publisher:PEARSON
The Basic Practice of Statistics
Statistics
ISBN:9781319042578
Author:David S. Moore, William I. Notz, Michael A. Fligner
Publisher:W. H. Freeman
Introduction to the Practice of Statistics
Statistics
ISBN:9781319013387
Author:David S. Moore, George P. McCabe, Bruce A. Craig
Publisher:W. H. Freeman