MATLAB: An Introduction with Applications
6th Edition
ISBN: 9781119256830
Author: Amos Gilat
Publisher: John Wiley & Sons Inc
expand_more
expand_more
format_list_bulleted
Question
thumb_up100%

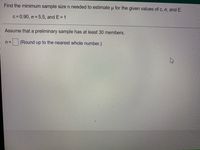
Transcribed Image Text:Find the minimum sample size n needed to estimate u for the given values of c, o, and E.
c= 0.90, o = 5.5, and E = 1
Assume that a preliminary sample has at least 30 members.
(Round up to the nearest whole number.)
Expert Solution
This question has been solved!
Explore an expertly crafted, step-by-step solution for a thorough understanding of key concepts.
This is a popular solution
Trending nowThis is a popular solution!
Step by stepSolved in 2 steps with 2 images

Knowledge Booster
Similar questions
- Consider random samples of size 44 drawn from population A with proportion 0.32 and random samples of size 30 drawn from population B with proportion 0.25.arrow_forwardCalculate the smallest sample size required to estimate the population mean under the specifications shown below. a. confidence level 90%, σ=19, and e=6 b. confidence level 95%, σ=23, and e=0.7 c. confidence level 98%, σ=0.5, and e=1 d. confidence level 99%, σ=1.4, and e=0.6 e. confidence level 98%, σ=5, and e=arrow_forwardDetermine and from the given parameters of the population and sample size. 77, 9, n = 37 X (Round to three decimal places as needed.)arrow_forward
- 1. Consider the dataset below: 3 -574828-3-6 a) What is the sample size? b) Calculate the sample mean. c) Find the sample median. d) What is the shape of the distribution? e) Find Qi, Q and Qs.arrow_forwardB,C?arrow_forwardA sample is selected from a normal population with µ = 54 and σ = 8. Which of the following samples would be considered extreme and unrepresentative for this population? A. M = 53 and n = 81 B. M = 52 and n = 36 C. M = 53 and n = 36 D. M = 52 and n = 81arrow_forward
- 1) Review the paired samples t test equation below and answer the questions: 1a. What is d with the bar over it called and how do you find it? 1b. What is the S (with subnotation of d) called? 1c. What is n?arrow_forward3. Can SAT scores predict college performance? Let x be a variable that represents SAT score of a computer science major, and let y be a variable that represents a student’s GPA upon graduation. A random sample of n =15 computer science majors provided their SAT scores and GPAs: x 1232 1070 1086 1287 1130 1048 1121 1095 1135 1208 1333 1160 1186 1243 1261 y 3.52 2.91 2.4 3.47 3.47 2.37 2.4 2.24 3.02 3.32 3.59 2.54 3.19 3.71 3.58 The scatter diagram for the SAT score and GPA is given below: (a) Find the sample correlation coefficient r. Truncate to two decimal places. What does the value tell you about the data? (b) Find the equation of the least squares line . Truncate to four decimal places. What does the slope mean? (c) Find the value of the coefficient of determination . Truncate to two decimal places. What does this number mean? (d) What is the predicted GPA if a computer science major got a…arrow_forwardA population consists of the following N= 6 scores: 0, 4, 6, 1, 3, and 5. Compute u and o for the population. Find the z-score for each score in the population. Transform the original population into a new population of N=6 scores with µ = 50 and o = 10.arrow_forward
- 8.2-2arrow_forwardNOTE: show your solutionarrow_forward6. Given the following sample of n = 10 scores, for each individual score calculate the following: a) z-score b) a new standardized score with M = 50 and s = 20 X 19 10 2 16 13 4 11 6 18 15 X 19 10 2 6341618 15 z-score Standardized Scorearrow_forward
arrow_back_ios
arrow_forward_ios
Recommended textbooks for you
 MATLAB: An Introduction with ApplicationsStatisticsISBN:9781119256830Author:Amos GilatPublisher:John Wiley & Sons Inc
 Probability and Statistics for Engineering and th...StatisticsISBN:9781305251809Author:Jay L. DevorePublisher:Cengage Learning
 Statistics for The Behavioral Sciences (MindTap C...StatisticsISBN:9781305504912Author:Frederick J Gravetter, Larry B. WallnauPublisher:Cengage Learning
 Elementary Statistics: Picturing the World (7th E...StatisticsISBN:9780134683416Author:Ron Larson, Betsy FarberPublisher:PEARSON
 The Basic Practice of StatisticsStatisticsISBN:9781319042578Author:David S. Moore, William I. Notz, Michael A. FlignerPublisher:W. H. Freeman
 Introduction to the Practice of StatisticsStatisticsISBN:9781319013387Author:David S. Moore, George P. McCabe, Bruce A. CraigPublisher:W. H. Freeman

MATLAB: An Introduction with Applications
Statistics
ISBN:9781119256830
Author:Amos Gilat
Publisher:John Wiley & Sons Inc

Probability and Statistics for Engineering and th...
Statistics
ISBN:9781305251809
Author:Jay L. Devore
Publisher:Cengage Learning

Statistics for The Behavioral Sciences (MindTap C...
Statistics
ISBN:9781305504912
Author:Frederick J Gravetter, Larry B. Wallnau
Publisher:Cengage Learning

Elementary Statistics: Picturing the World (7th E...
Statistics
ISBN:9780134683416
Author:Ron Larson, Betsy Farber
Publisher:PEARSON

The Basic Practice of Statistics
Statistics
ISBN:9781319042578
Author:David S. Moore, William I. Notz, Michael A. Fligner
Publisher:W. H. Freeman

Introduction to the Practice of Statistics
Statistics
ISBN:9781319013387
Author:David S. Moore, George P. McCabe, Bruce A. Craig
Publisher:W. H. Freeman