
MATLAB: An Introduction with Applications
6th Edition
ISBN: 9781119256830
Author: Amos Gilat
Publisher: John Wiley & Sons Inc
expand_more
expand_more
format_list_bulleted
Related questions
Question
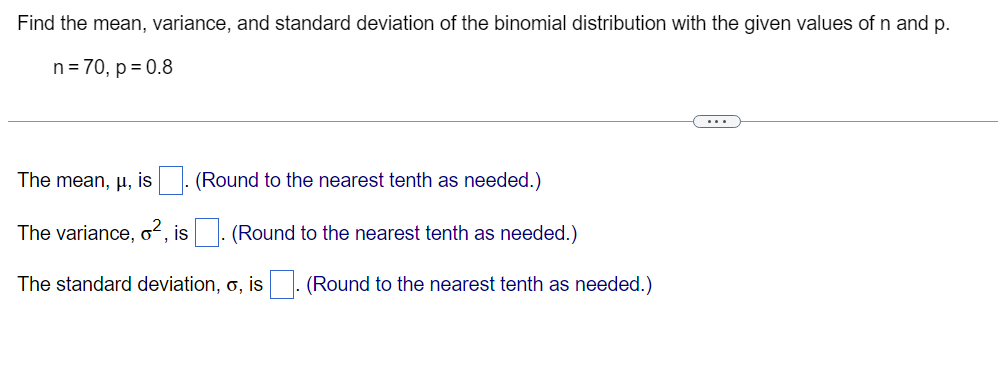

Transcribed Image Text:Find the mean, variance, and standard deviation of the binomial distribution with the given values of n and p.
n = 70, p = 0.8
The mean, μ, is
(Round to the nearest tenth as needed.)
The variance, o², is . (Round to the nearest tenth as needed.)
The standard deviation, o, is (Round to the nearest tenth as needed.)
Expert Solution
This question has been solved!
Explore an expertly crafted, step-by-step solution for a thorough understanding of key concepts.

Step by stepSolved in 3 steps with 5 images

Knowledge Booster

Similar questions
- The scores on the Accuplacer test and High School GPAS are normally distributed. The Accuplacer test had a mean of 35 and a standard deviation of 9. High School GPAS had a mean of 2.8 and a standard deviation of 0.2. What high school GPA do you need to equal a score of 56 on the Accuplacer test? Give answer to two decimal placés. Check Answerarrow_forwardUse z-scores to make the following comparison. A high school student took two college entrance exams, scoring 1110 on the SAT and 27 on the ACT. Suppose that SAT scores have a mean of 950 and a standard deviation of 130 while the ACT scores have a mean of 22 and a standard deviation of 4. Assuming the performance on both tests follows a normal distribution, determine which test the student did better on.arrow_forwardUse the sample data set to evaluate each of the steps in determining the sample standard deviation 23 20 14 35 28 Give an exact answer, not an approximation, for each step except the standard deviation. round the standard deviation to the nearest hundredth.. = = variance, s2 = standard deviation, s =arrow_forward
- A normal distribution has a mean of 85.8 and a standard deviation of 4.89. Find the data value corresponding to the value of z given. (Enter your answer to four decimal places.) z = −3.49arrow_forwardJust do 2 and 3 please.arrow_forwardThe following table gives the math SAT scores for some recent selected years. Find the average, variance, and standard deviation of each. (Round your answers to four decimal places.) Males 499 502 504 503 498 Females 446 453 455 452 450 Males: mean variance standard deviation Females: mean variance standard deviationarrow_forward
- Which is NOT a correct statement about the variance and standard deviation? a. The standard deviation is the sqaure root of the variance b. The standard deviation is useful when considering how close the data are to the mean c. The variance is roughly the average sqaured distance from the mean d. None of abovearrow_forwardThe variance and the standard deviation are related by the fact that the square root of the variance is equal to the standard deviation. Suppose the variance of the time it takes to complete a bachelor's degree is 0.8. Find the standard deviation. Round your answer to four decimal places.arrow_forwardThe following table gives the math SAT scores for some recent selected years. Find the average, variance, and standard deviation of each. (Round your answers to four decimal places.) Males 500 502 498 504 497 Females 446 453 450 454 451 Males: mean variance standard deviation Females: mean variance standard deviation Which group is varying more? femalesmales cannot be determinedarrow_forward
- For computing the variance this number is called as the value that is added or subtracted from the most probable value a. accuracy b. mistake c. error d. probable errorarrow_forwardCompute the (sample) variance and standard deviation of the data sample. (Round your answers to two decimal places.) −1, 7, 7, 3, 14 Variance: Standard Deviation:arrow_forward
arrow_back_ios
arrow_forward_ios
Recommended textbooks for you
- MATLAB: An Introduction with ApplicationsStatisticsISBN:9781119256830Author:Amos GilatPublisher:John Wiley & Sons Inc
 Probability and Statistics for Engineering and th...StatisticsISBN:9781305251809Author:Jay L. DevorePublisher:Cengage Learning
 Statistics for The Behavioral Sciences (MindTap C...StatisticsISBN:9781305504912Author:Frederick J Gravetter, Larry B. WallnauPublisher:Cengage Learning
  Elementary Statistics: Picturing the World (7th E...StatisticsISBN:9780134683416Author:Ron Larson, Betsy FarberPublisher:PEARSON
 The Basic Practice of StatisticsStatisticsISBN:9781319042578Author:David S. Moore, William I. Notz, Michael A. FlignerPublisher:W. H. Freeman
 Introduction to the Practice of StatisticsStatisticsISBN:9781319013387Author:David S. Moore, George P. McCabe, Bruce A. CraigPublisher:W. H. Freeman
MATLAB: An Introduction with Applications
Statistics
ISBN:9781119256830
Author:Amos Gilat
Publisher:John Wiley & Sons Inc
Probability and Statistics for Engineering and th...
Statistics
ISBN:9781305251809
Author:Jay L. Devore
Publisher:Cengage Learning
Statistics for The Behavioral Sciences (MindTap C...
Statistics
ISBN:9781305504912
Author:Frederick J Gravetter, Larry B. Wallnau
Publisher:Cengage Learning
Elementary Statistics: Picturing the World (7th E...
Statistics
ISBN:9780134683416
Author:Ron Larson, Betsy Farber
Publisher:PEARSON
The Basic Practice of Statistics
Statistics
ISBN:9781319042578
Author:David S. Moore, William I. Notz, Michael A. Fligner
Publisher:W. H. Freeman
Introduction to the Practice of Statistics
Statistics
ISBN:9781319013387
Author:David S. Moore, George P. McCabe, Bruce A. Craig
Publisher:W. H. Freeman