
MATLAB: An Introduction with Applications
6th Edition
ISBN: 9781119256830
Author: Amos Gilat
Publisher: John Wiley & Sons Inc
expand_more
expand_more
format_list_bulleted
Related questions
Question
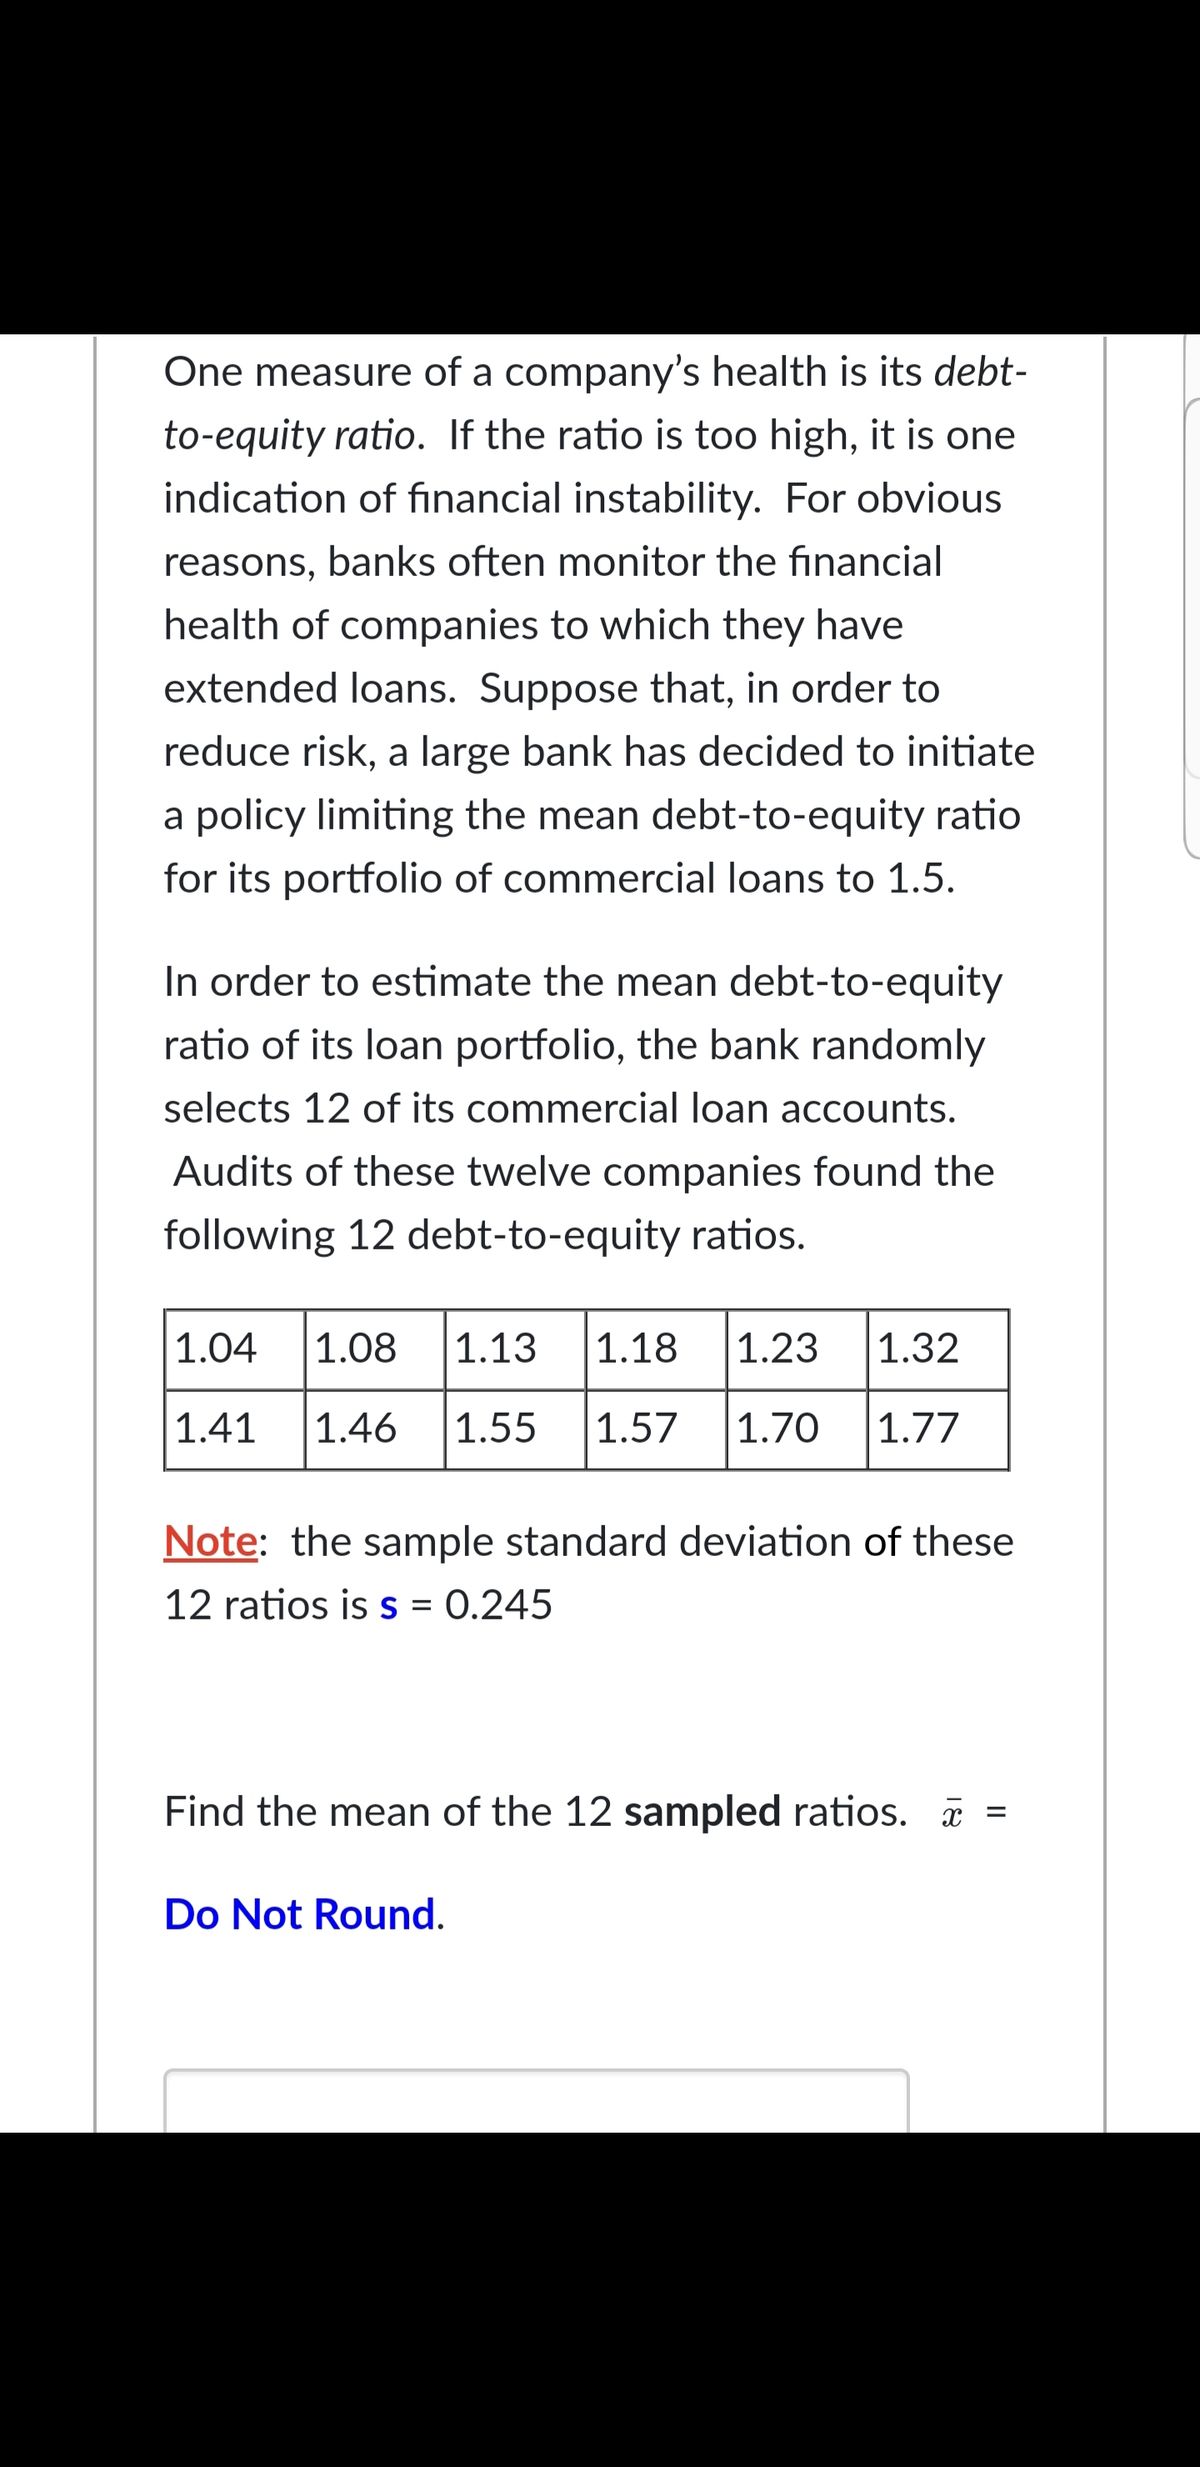

Transcribed Image Text:One measure of a company's health is its debt-
to-equity ratio. If the ratio is too high, it is one
indication of financial instability. For obvious
reasons, banks often monitor the financial
health of companies to which they have
extended loans. Suppose that, in order to
reduce risk, a large bank has decided to initiate
a policy limiting the mean debt-to-equity ratio
for its portfolio of commercial loans to 1.5.
In order to estimate the mean debt-to-equity
ratio of its loan portfolio, the bank randomly
selects 12 of its commercial loan accounts.
Audits of these twelve companies found the
following 12 debt-to-equity ratios.
1.04
1.08
|1.13
1.18
1.23
|1.32
1.41
1.46
1.55
1.57
1.70
|1.77
Note: the sample standard deviation of these
12 ratios is s = 0.245
Find the mean of the 12 sampled ratios. =
Do Not Round.
Expert Solution
arrow_forward
Step 1
Mean is defined as the sum of observations divided by number of observations.
Number of observations n = 12

Step by stepSolved in 2 steps

Knowledge Booster

Similar questions
- A. Determine the coefficient of determination, r2, and interpret its meaning. (Fill in the Blank) r2 = ___? (Round to four decimal places as needed.) B. What is the meaning of the coefficient ofdetermination? (Choose Below) A. It measures the variability in the actual plate gap from the predicted plate gap. B. It measures the variability in the actual tear rating from the predicted tear rating. C. It is the proportion of the variation in the plate gap that is explained by the variability in the tear rating. D. It is the proportion of the variation in the tear rating that is explained by the variability in the plate gap. C. Determine the standard error of the estimate. SYX = ___? (Round to four decimal places asneeded.)arrow_forwardIs parameter proportion the same as statistical proportion. so lets say the statistical proportion is 0.49. Would the parameter proportion be 0.49 as well ?arrow_forwardixd s 67 Dr 5. Find the percentage of data points that lie above z 1.03. Draw a picture to support your work.arrow_forward
- . How high are the levels for the highest (top) 4.8% of all children? Z- score = Answer =arrow_forwardUse the data in the following table, which lists carbon dioxide concentrations (in parts per million) for each year from 1960 to 2009, with projected values used for the last four years. After finding the values of the mean and range for each decade, find the values of x, and R. Also find the values of LCL and UCL for an R chart, and find the values of LCL and UCL for an x chart. 1960s 318.4 319.5 321.8 322.9 324.8 325.4 326.9 328.5 330.3 331.4 1970s 333.4 334.6 335.5 337.1 339.3 340.4 341.4 343.1 344.7 346.5 1980s 348.1 348.8 351.2 352.1 353.8 355.4 356.9 358.5 359.8 360.6 1990s 361.9 363.6 365.8 366.7 368.6 369.2 371.7 372.4 373.5 375.2 2000s 377.6 378.7 379.6 381.8 382.8 384.2 386.3 387.6 388.7 390.5 x=enter your response here (Round to three decimal places as needed.) Part 2 R=enter your response here (Round to two decimal places as needed.) Compute the values of LCL and UCL for an R chart. LCL=enter your response here, UCL=enter your response here (Round to…arrow_forward
arrow_back_ios
arrow_forward_ios
Recommended textbooks for you
- MATLAB: An Introduction with ApplicationsStatisticsISBN:9781119256830Author:Amos GilatPublisher:John Wiley & Sons Inc
 Probability and Statistics for Engineering and th...StatisticsISBN:9781305251809Author:Jay L. DevorePublisher:Cengage Learning
 Statistics for The Behavioral Sciences (MindTap C...StatisticsISBN:9781305504912Author:Frederick J Gravetter, Larry B. WallnauPublisher:Cengage Learning
  Elementary Statistics: Picturing the World (7th E...StatisticsISBN:9780134683416Author:Ron Larson, Betsy FarberPublisher:PEARSON
 The Basic Practice of StatisticsStatisticsISBN:9781319042578Author:David S. Moore, William I. Notz, Michael A. FlignerPublisher:W. H. Freeman
 Introduction to the Practice of StatisticsStatisticsISBN:9781319013387Author:David S. Moore, George P. McCabe, Bruce A. CraigPublisher:W. H. Freeman
MATLAB: An Introduction with Applications
Statistics
ISBN:9781119256830
Author:Amos Gilat
Publisher:John Wiley & Sons Inc
Probability and Statistics for Engineering and th...
Statistics
ISBN:9781305251809
Author:Jay L. Devore
Publisher:Cengage Learning
Statistics for The Behavioral Sciences (MindTap C...
Statistics
ISBN:9781305504912
Author:Frederick J Gravetter, Larry B. Wallnau
Publisher:Cengage Learning
Elementary Statistics: Picturing the World (7th E...
Statistics
ISBN:9780134683416
Author:Ron Larson, Betsy Farber
Publisher:PEARSON
The Basic Practice of Statistics
Statistics
ISBN:9781319042578
Author:David S. Moore, William I. Notz, Michael A. Fligner
Publisher:W. H. Freeman
Introduction to the Practice of Statistics
Statistics
ISBN:9781319013387
Author:David S. Moore, George P. McCabe, Bruce A. Craig
Publisher:W. H. Freeman