
MATLAB: An Introduction with Applications
6th Edition
ISBN: 9781119256830
Author: Amos Gilat
Publisher: John Wiley & Sons Inc
expand_more
expand_more
format_list_bulleted
Related questions
Question
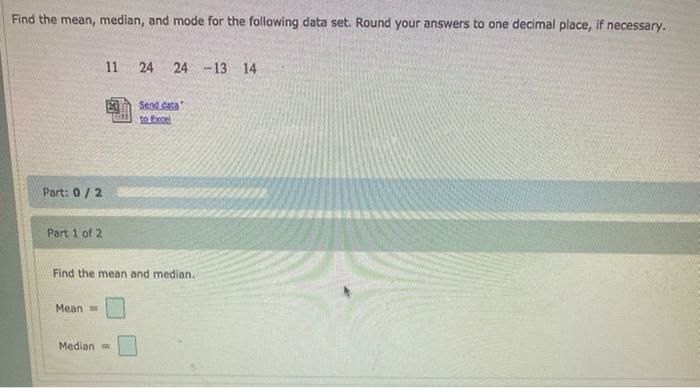

Transcribed Image Text:Find the mean, median, and mode for the following data set. Round your answers to one decimal place, if necessary.
Part: 0/2
Part 1 of 2
Mean=
11
Median
24 24 -13 14
Find the mean and median.
Send data
to Excel
Expert Solution
This question has been solved!
Explore an expertly crafted, step-by-step solution for a thorough understanding of key concepts.

This is a popular solution

Trending nowThis is a popular solution!

Step by stepSolved in 2 steps

Knowledge Booster

Similar questions
- Please do this in excel and show me how to do it. Need helparrow_forwardGive a 5-Number Summary for the data below. Also, find the IQR. 8 15 32 36 45 47 58 61 63 75 77 78 79 91 92 98arrow_forwardDescribe the shape of the data presented: Number of students 10 9 8 87 3 2 1 0 0 Hours Spent Playing Video Games on Weekends 5 10 15 20 25arrow_forward
- B. Directions: For each of the following, calculate the mean, median and mode. Show your solution. (Ungrouped data) 1. 7, 8, 9, 5, 8, 7, 7, 9, 8, 6 2. 100, 120, 132, 122, 145, 121, 105, 109, 3. 115, 119, 114, 112, 112, 109, 104, 106arrow_forwardFind the 5 number summary for the data shown below. 31 3 27 34 53 86 15 94 82 5 number summary: Submit Questionarrow_forwardRun the descriptive statistics for hrs/week of exercise. Include the mean, median, quartiles, min, max, standard deviation and IQR. First do this for hrs/week of exercise overall. Copy and paste the values below. Then redo this splitting up the data by sex. Copy and paste that below too. What similarities and/or differences do you see? Age Gender Height Arm Length Number Siblings Birth Order Handedness Number Classes Number Credits Hrs. Exercise Athlete at Broome Hrs. TV Award Pulse Number Piercings Facebook Friends Followers on Instagram Tattoo Division Local section 18 f 63 27.5 2 3 r 4 14 1.5 n 3 NP 74 2 82 72 n HS y 4 19 m 74 31.5 4 5 r 4 11 5 n 1.5 O 0 600 700 n STEM y 4 17 f 66 29.2 2 2 l 6 15 5 y 21 NP 64 2 1801 1370 n HS y 4 18 f 66 30 5 5 r 4 12 30 n 15 NP 91 1…arrow_forward
- Consider the data set: 7 8 4 2 1 3 9 3 Find the mean: (Round your answer to 3 decimal places if necessary) Find the median: (Round your answer to 3 decimal places if necessary)arrow_forwardUse the birth weights (grams) of 50 babies from the data set "Births." Use software or a calculator to find the mean and median. Examine the list of birth weights to make an observation about those numbers. How does that observation affect the way that the results should be rounded? Click the icon to view the birth weight data. - X The mean birth weight is Birth weights (grams) grams. (Round to one decimal place as needed.) 300 4900 4000 3600 3400 3000 3700 2900 3700 3100 3400 3500 4100 3200 2900 2800 3500 3100 3300 3800 3800 2300 3300 2600 2400 3400 3300 4000 2800 3600 3100 2800 2800 2500 2600 2700 2600 3000 2900 3600 300 3400 3500 3400 3600 3400 3200 2600 3600 3500arrow_forwardFind the 5 number summary for the data shown. 2 3 9. 26 43 46 68 72 86 87| 92 95 number summary: N 5arrow_forward
- Find the mean, median, and mode of the data set 9 4 8 4 7 mean (Enter a number.) median (Enter an exact number.) mode (Enter an exact number.)arrow_forwardFor the data set 7 6 4 9 5 the medianarrow_forwardFind the 5 number summary for the data shown. 1 6 13 16 19 23 29 51 54 67 76 80 91 5 number summary:arrow_forward
arrow_back_ios
SEE MORE QUESTIONS
arrow_forward_ios
Recommended textbooks for you
- MATLAB: An Introduction with ApplicationsStatisticsISBN:9781119256830Author:Amos GilatPublisher:John Wiley & Sons Inc
 Probability and Statistics for Engineering and th...StatisticsISBN:9781305251809Author:Jay L. DevorePublisher:Cengage Learning
 Statistics for The Behavioral Sciences (MindTap C...StatisticsISBN:9781305504912Author:Frederick J Gravetter, Larry B. WallnauPublisher:Cengage Learning
  Elementary Statistics: Picturing the World (7th E...StatisticsISBN:9780134683416Author:Ron Larson, Betsy FarberPublisher:PEARSON
 The Basic Practice of StatisticsStatisticsISBN:9781319042578Author:David S. Moore, William I. Notz, Michael A. FlignerPublisher:W. H. Freeman
 Introduction to the Practice of StatisticsStatisticsISBN:9781319013387Author:David S. Moore, George P. McCabe, Bruce A. CraigPublisher:W. H. Freeman
MATLAB: An Introduction with Applications
Statistics
ISBN:9781119256830
Author:Amos Gilat
Publisher:John Wiley & Sons Inc
Probability and Statistics for Engineering and th...
Statistics
ISBN:9781305251809
Author:Jay L. Devore
Publisher:Cengage Learning
Statistics for The Behavioral Sciences (MindTap C...
Statistics
ISBN:9781305504912
Author:Frederick J Gravetter, Larry B. Wallnau
Publisher:Cengage Learning
Elementary Statistics: Picturing the World (7th E...
Statistics
ISBN:9780134683416
Author:Ron Larson, Betsy Farber
Publisher:PEARSON
The Basic Practice of Statistics
Statistics
ISBN:9781319042578
Author:David S. Moore, William I. Notz, Michael A. Fligner
Publisher:W. H. Freeman
Introduction to the Practice of Statistics
Statistics
ISBN:9781319013387
Author:David S. Moore, George P. McCabe, Bruce A. Craig
Publisher:W. H. Freeman