
MATLAB: An Introduction with Applications
6th Edition
ISBN: 9781119256830
Author: Amos Gilat
Publisher: John Wiley & Sons Inc
expand_more
expand_more
format_list_bulleted
Related questions
Concept explainers
Question
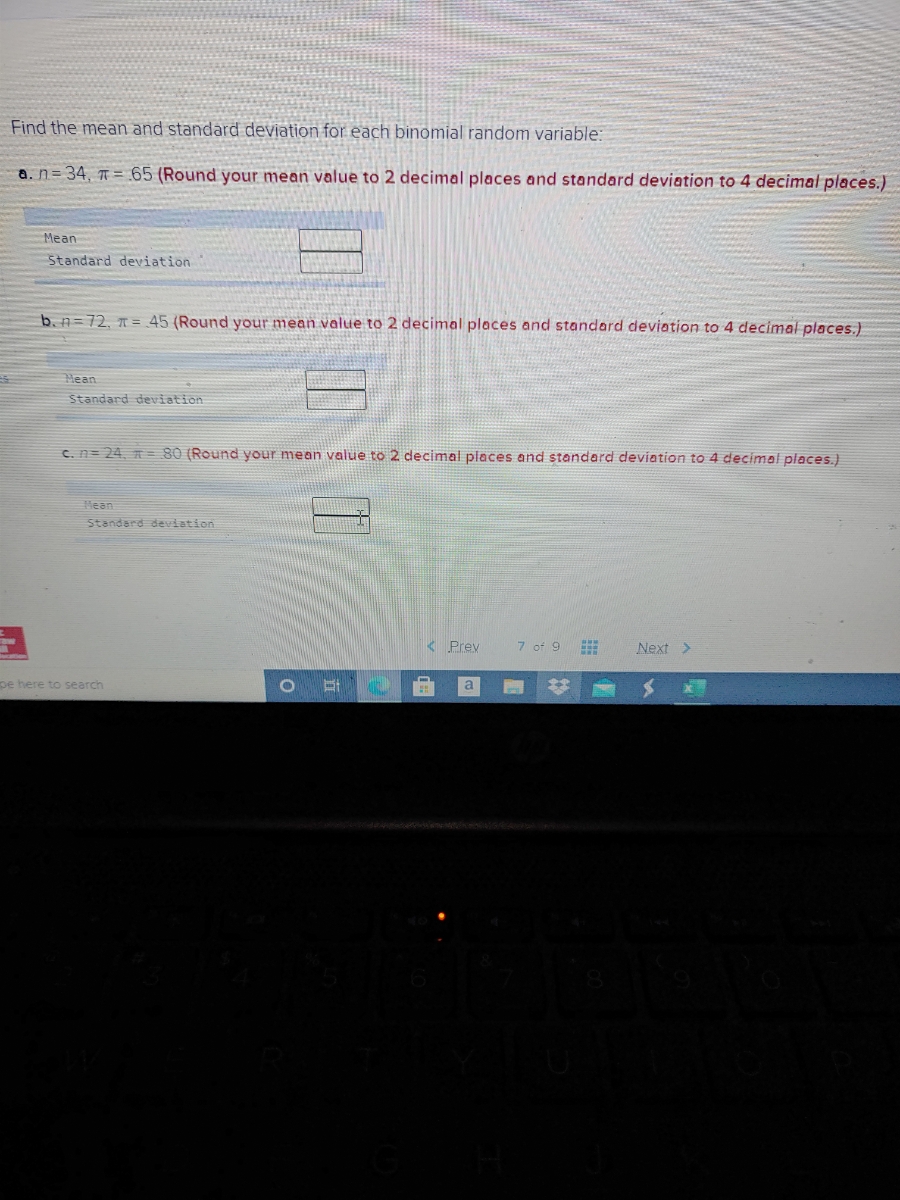

Transcribed Image Text:Find the mean and standard deviation for each binomial random variable:
a. n=34, = 65 (Round your mean value to 2 decimal places and standard deviation to 4 decimal places.)
Mean
Standard deviation
b. n=72, = 45 (Round your mean value to 2 decimal places and standard deviation to 4 decimal places.)
Mean
Standard deviation
C. n= 24, n= 80 (Round your mean value to 2 decimal places and standard deviation to 4 decimal places,)
Mean
Standard deviation
< Prey
7 of 9
Next >
pe here to search
a
Expert Solution
This question has been solved!
Explore an expertly crafted, step-by-step solution for a thorough understanding of key concepts.

This is a popular solution

Trending nowThis is a popular solution!

Step by stepSolved in 3 steps with 6 images

Knowledge Booster


Learn more about
Need a deep-dive on the concept behind this application? Look no further. Learn more about this topic, statistics and related others by exploring similar questions and additional content below.Similar questions
- Q12arrow_forwardSolve the last part what is the source of variability in the random variable? B. The sample size was weingarrow_forwardCalculate the mean of the data, and then calculate the deviations for each of the 6 scores. Using that information, calculate the variance and standard deviation of the data set, and then calculate a Z-Score for each of the 6 scores in the data set. 6, 10, 9, 13, 14, 11arrow_forward
- Calculate the expected value, the variance, and the standard deviation of the given random variable X. (Round all answers to two decimal places.) X is the number of red marbles that Suzan has in her hand after she selects three marbles from a bag containing three red marbles and two green ones. expected value variance standard deviationarrow_forwardA fitness center bought a new exercise machine called the Mountain Climber. They decided to keep track of how many people used the machine over a 3-hour period. Here X is the number of people who used the machine. X 0 1 2 3 4 PX 0.2 0.2 0.1 0.4 0.1 Find the mean,variance and standard deviationarrow_forwardAssume the random variable X is normally distributed, with mean u= 44 and standard deviationo = 9. Find the 13th percentile.arrow_forward
- Eighty-three percent of adults in a certain country believe that life on other planets is plausible. You randomly select five adults and ask them whether they believe that life on other planets is plausible. The random variable represents the number of adults who believe that life on other planets is plausible. Find the mean, variance, and standard deviation of the binomial distribution for the random variable. Interpret the results find the mean, variance, and standard deviationarrow_forwardFind the mean, variance, and standard deviation of the binomial distribution with the given values of n and p. n=123, p equals 0.48arrow_forward61% percent of adults in a certain country believe that life on other planets is plausible. You randomly select 5 adults and ask them whether they believe that life on other planets is plausible. The random variable represents the number of adults who believe that life on other planets is plausible. Find the mean, variance, and standard deviation of the binomial distribution for the random variable, then interpret the results. The mean= 3.85The variance= 0.89 The standard deviation= 0.94 On average, _________ out of every 5 adults in the country believe that life on other planets is plausible. In most samples of 5 adults, the number of adults who think life on other planets is plausible would differ from the mean by no more than _________.arrow_forward
- Susan jogs to the park each day and the trip takes an average of µ = 22 minutes. The distribution of jog times is approximately normal with a standard deviation of σ = 10 minutes. For a randomly selected day, what is the probability that Susan’s jog to the park will take less than 16 minutes? Select one: a. 0.2743 b. 0.8957 c. 0.3236 d. 0.7554arrow_forwardA surgery has a success rate of 90%. Suppose that the surgery is performed on threepatients Graph the probability distribution for X using a histogram.Find the mean of X.Find the variance and standard deviation of X.arrow_forwardAssume time to failure density function (in months) of transplanted kidneys has a Weibull distribution with shape factor of 3 and scale of 6. Use R and answer the following questions (enter your answers with 3 decimal points):arrow_forward
arrow_back_ios
SEE MORE QUESTIONS
arrow_forward_ios
Recommended textbooks for you
- MATLAB: An Introduction with ApplicationsStatisticsISBN:9781119256830Author:Amos GilatPublisher:John Wiley & Sons Inc
 Probability and Statistics for Engineering and th...StatisticsISBN:9781305251809Author:Jay L. DevorePublisher:Cengage Learning
 Statistics for The Behavioral Sciences (MindTap C...StatisticsISBN:9781305504912Author:Frederick J Gravetter, Larry B. WallnauPublisher:Cengage Learning
  Elementary Statistics: Picturing the World (7th E...StatisticsISBN:9780134683416Author:Ron Larson, Betsy FarberPublisher:PEARSON
 The Basic Practice of StatisticsStatisticsISBN:9781319042578Author:David S. Moore, William I. Notz, Michael A. FlignerPublisher:W. H. Freeman
 Introduction to the Practice of StatisticsStatisticsISBN:9781319013387Author:David S. Moore, George P. McCabe, Bruce A. CraigPublisher:W. H. Freeman
MATLAB: An Introduction with Applications
Statistics
ISBN:9781119256830
Author:Amos Gilat
Publisher:John Wiley & Sons Inc
Probability and Statistics for Engineering and th...
Statistics
ISBN:9781305251809
Author:Jay L. Devore
Publisher:Cengage Learning
Statistics for The Behavioral Sciences (MindTap C...
Statistics
ISBN:9781305504912
Author:Frederick J Gravetter, Larry B. Wallnau
Publisher:Cengage Learning
Elementary Statistics: Picturing the World (7th E...
Statistics
ISBN:9780134683416
Author:Ron Larson, Betsy Farber
Publisher:PEARSON
The Basic Practice of Statistics
Statistics
ISBN:9781319042578
Author:David S. Moore, William I. Notz, Michael A. Fligner
Publisher:W. H. Freeman
Introduction to the Practice of Statistics
Statistics
ISBN:9781319013387
Author:David S. Moore, George P. McCabe, Bruce A. Craig
Publisher:W. H. Freeman