
MATLAB: An Introduction with Applications
6th Edition
ISBN: 9781119256830
Author: Amos Gilat
Publisher: John Wiley & Sons Inc
expand_more
expand_more
format_list_bulleted
Related questions
Question
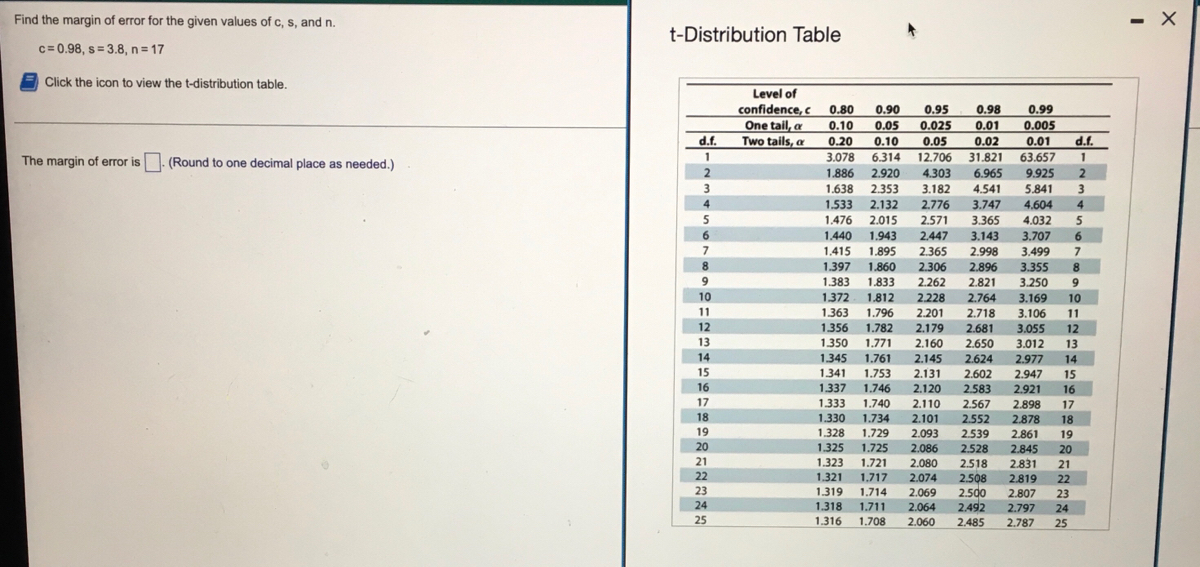

Transcribed Image Text:Find the margin of error for the given values of c, s, and n.
t-Distribution Table
c= 0.98, s = 3.8, n = 17
Click the icon to view the t-distribution table.
Level of
confidence, c 0.80
One tail, a
Two tails, a
0.90
0.95
0.98
0.99
0.05
0.10
0.20
3.078
0.025
0.01
0.005
d.f.
0.10
0.05
0.02
0.01
d.f.
6.314
12.706
31.821
63.657
9.925
1
The margin of error is. (Round to one decimal place as needed.)
2.
1,886
2.920
4.303
6.965
1.638
2.353
3.182
4.541
5.841
3.
4
3.747
1,533
1.476
2.132
2.015
2.776
4,604
4
5
2.571
3.365
4.032
1.440
1.943
2.447
3.143
3.707
6.
7
1,415
207
1.397
1.895
2.365
2.306
2.998
3.499
8.
1.860
2.896
3.355
8.
2 250
9.
1,383
1,833
2.262
2.821
3.250
2.764
2.718
10
1372
1.812
2.228
3.169
10
11
1.363
1.796
2.201
3.106
11
12
13
1356
1.350
1.345
1.341
1.782
2.179
2.681
3.055
12
1,771
2.160
2.650
3.012
13
14
2.145
2.131
1.761
2.624
2.977
14
15
2.602
2.583
1.753
2.947
15
16
1337
2.120
2.110
1.746
2.921
16
17
1,740
1.333
1.330
2.567
2.898
17
18
1.734
2.101
2.552
2.539
2.528
2.518
2.878
18
19
1.328
1.729
1.725
2.093
2.861
19
20
1.325
2.086
2.845
2.831
20
21
1.323
1.321
1.721
2.080
21
22
1.717
2.074
2.508
2.5d0
2.819
22
23
1.319
1.714
2.069
2.807
23
2.797
2.787
24
1.318
1.711
2.064
2.492
24
25
1.316
1.708
2.060
2.485
25
Expert Solution
This question has been solved!
Explore an expertly crafted, step-by-step solution for a thorough understanding of key concepts.

This is a popular solution

Trending nowThis is a popular solution!

Step by stepSolved in 2 steps

Knowledge Booster

Similar questions
- Find the margin of error for the given values of c, s, and n. c= 0.99, s= 2.7, n = 12 Click the icon to view the t-distribution table. The margin of error is . (Round to one decimal place as needed.)arrow_forwardFind the margin of error for the given values of c, s, and n. c = 0.99, s 6, n = 13 Click the icon to view the t-distribution table. The margin of error is (Round to one decimal place as needed.)arrow_forwardFind the interval of z-values associated with each area. a. The middle 75% of the data. b. The top 5% of the dataarrow_forward
- R1arrow_forwardFind the margin of error for the given values of c, s, and n. c%3D0.95, s%3D3.6 , n 16 F Click the icon to view the t-distribution table. The margin of error is (Round to one decimal place as needed.) Get more help-arrow_forwardFind the margin of error for the given values of c, s, and n. c=0.90, s = 3.5, n = 6 Click the icon to view the t-distribution table. The margin of error is (Round to three decimal places as needed.)arrow_forward
- ixd s 67 Dr 5. Find the percentage of data points that lie above z 1.03. Draw a picture to support your work.arrow_forwardAssume that the readings on the thermometers are normally distributed with a mean of 0° and standard deviation of 1.00°C. A thermometer is randomly selected and tested. Draw a sketch and find the temperature reading corresponding to P34, the 84th percentile. This is the temperature reading separating the bottom 84% from the top 16%. Click to view page 1 of the table. Click to view page 2 of the table. Which graph represents P ? Choose the correct graph below. 84 A. В. OC. D. Ay X The temperature for P84 is approximately (Round to two decimal places as needed.)arrow_forwardFind the z-scores for which 80% of the distribution's area lies between -z and z. Click to view page 1 of the table. Click to view page 2 of the table. The Z-scores are (Use a comma to separate answers as needed. Round to two decimal places as needed.) Carrow_forward
arrow_back_ios
arrow_forward_ios
Recommended textbooks for you
- MATLAB: An Introduction with ApplicationsStatisticsISBN:9781119256830Author:Amos GilatPublisher:John Wiley & Sons Inc
 Probability and Statistics for Engineering and th...StatisticsISBN:9781305251809Author:Jay L. DevorePublisher:Cengage Learning
 Statistics for The Behavioral Sciences (MindTap C...StatisticsISBN:9781305504912Author:Frederick J Gravetter, Larry B. WallnauPublisher:Cengage Learning
  Elementary Statistics: Picturing the World (7th E...StatisticsISBN:9780134683416Author:Ron Larson, Betsy FarberPublisher:PEARSON
 The Basic Practice of StatisticsStatisticsISBN:9781319042578Author:David S. Moore, William I. Notz, Michael A. FlignerPublisher:W. H. Freeman
 Introduction to the Practice of StatisticsStatisticsISBN:9781319013387Author:David S. Moore, George P. McCabe, Bruce A. CraigPublisher:W. H. Freeman
MATLAB: An Introduction with Applications
Statistics
ISBN:9781119256830
Author:Amos Gilat
Publisher:John Wiley & Sons Inc
Probability and Statistics for Engineering and th...
Statistics
ISBN:9781305251809
Author:Jay L. Devore
Publisher:Cengage Learning
Statistics for The Behavioral Sciences (MindTap C...
Statistics
ISBN:9781305504912
Author:Frederick J Gravetter, Larry B. Wallnau
Publisher:Cengage Learning
Elementary Statistics: Picturing the World (7th E...
Statistics
ISBN:9780134683416
Author:Ron Larson, Betsy Farber
Publisher:PEARSON
The Basic Practice of Statistics
Statistics
ISBN:9781319042578
Author:David S. Moore, William I. Notz, Michael A. Fligner
Publisher:W. H. Freeman
Introduction to the Practice of Statistics
Statistics
ISBN:9781319013387
Author:David S. Moore, George P. McCabe, Bruce A. Craig
Publisher:W. H. Freeman