Find the indicated probability and interpret the result. From 1975 through 2020, the mean annual gain of the Dow Jones Industrial Average was 653. A random sample of 34 years is selected from this population. What is the probability that the mean gain for the sample was between 500 and 700? Assume σ = 1540. The probability is 2904. (Round to four decimal places as needed.) Interpret the result. Select the correct choice and fill in the answer box to complete your choice. (Round to two decimal places as needed.) A. About OB. About OC. About OD. About % of samples of 34 years will have an annual mean gain between 500 and 653. I % of samples of 34 years will have an annual mean gain between 500 and 700. % of samples of 46 years will have an annual mean gain between 500 and 700. % of samples of 34 years will have an annual mean gain between 653 and 700.
Find the indicated probability and interpret the result. From 1975 through 2020, the mean annual gain of the Dow Jones Industrial Average was 653. A random sample of 34 years is selected from this population. What is the probability that the mean gain for the sample was between 500 and 700? Assume σ = 1540. The probability is 2904. (Round to four decimal places as needed.) Interpret the result. Select the correct choice and fill in the answer box to complete your choice. (Round to two decimal places as needed.) A. About OB. About OC. About OD. About % of samples of 34 years will have an annual mean gain between 500 and 653. I % of samples of 34 years will have an annual mean gain between 500 and 700. % of samples of 46 years will have an annual mean gain between 500 and 700. % of samples of 34 years will have an annual mean gain between 653 and 700.

Chapter8: Sequences, Series,and Probability
Section: Chapter Questions
Problem 41CT: On a game show, a contestant is given the digits 3, 4, and 5 to arrange in the proper order to form...

Related questions
Question
Hshsvmilan
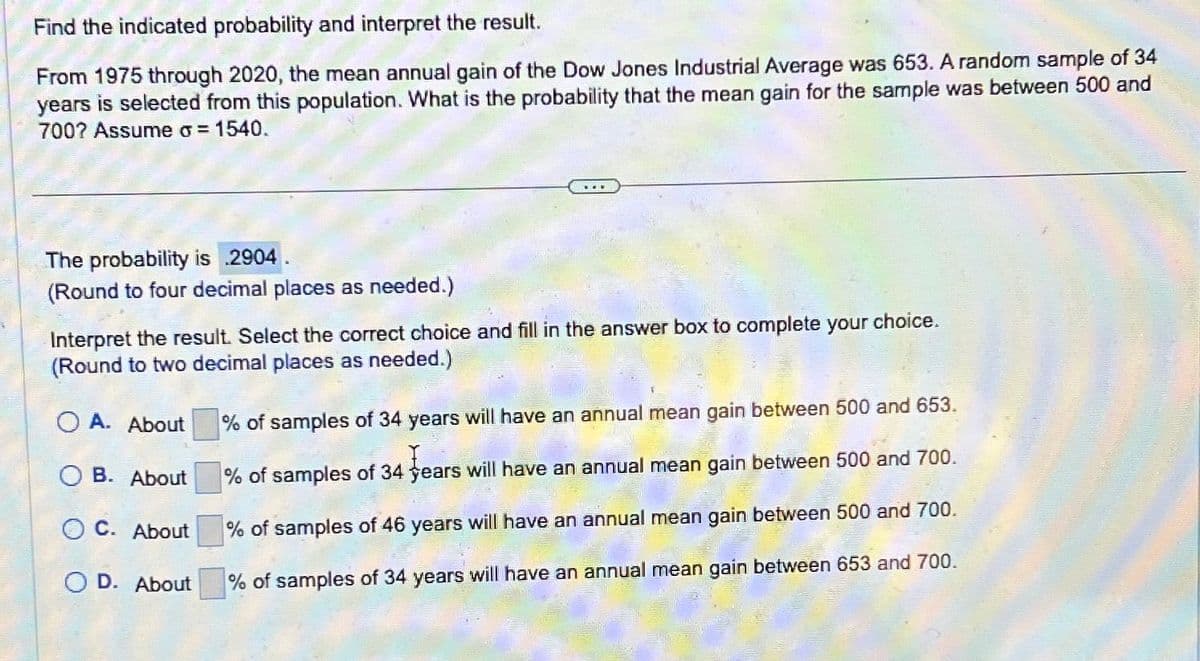
Transcribed Image Text:Find the indicated probability and interpret the result.
From 1975 through 2020, the mean annual gain of the Dow Jones Industrial Average was 653. A random sample of 34
years is selected from this population. What is the probability that the mean gain for the sample was between 500 and
700? Assume σ = 1540.
The probability is 2904
(Round to four decimal places as needed.)
Interpret the result. Select the correct choice and fill in the answer box to complete your choice.
(Round to two decimal places as needed.)
O A. About
OB. About
OC. About
OD. About
% of samples of 34 years will have an annual mean gain between 500 and 653.
% of samples of 34 years will have an annual mean gain between 500 and 700.
% of samples of 46 years will have an annual mean gain between 500 and 700.
% of samples of 34 years will have an annual mean gain between 653 and 700.
Expert Solution
This question has been solved!
Explore an expertly crafted, step-by-step solution for a thorough understanding of key concepts.

This is a popular solution!

Trending now
This is a popular solution!

Step by step
Solved in 3 steps with 4 images

Recommended textbooks for you

College Algebra (MindTap Course List)
Algebra
ISBN:
9781305652231
Author:
R. David Gustafson, Jeff Hughes
Publisher:
Cengage Learning

Holt Mcdougal Larson Pre-algebra: Student Edition…
Algebra
ISBN:
9780547587776
Author:
HOLT MCDOUGAL
Publisher:
HOLT MCDOUGAL
College Algebra (MindTap Course List)
Algebra
ISBN:
9781305652231
Author:
R. David Gustafson, Jeff Hughes
Publisher:
Cengage Learning
Holt Mcdougal Larson Pre-algebra: Student Edition…
Algebra
ISBN:
9780547587776
Author:
HOLT MCDOUGAL
Publisher:
HOLT MCDOUGAL

Glencoe Algebra 1, Student Edition, 9780079039897…
Algebra
ISBN:
9780079039897
Author:
Carter
Publisher:
McGraw Hill