
Glencoe Algebra 1, Student Edition, 9780079039897, 0079039898, 2018
18th Edition
ISBN: 9780079039897
Author: Carter
Publisher: McGraw Hill
expand_more
expand_more
format_list_bulleted
Related questions
Question
Question 3
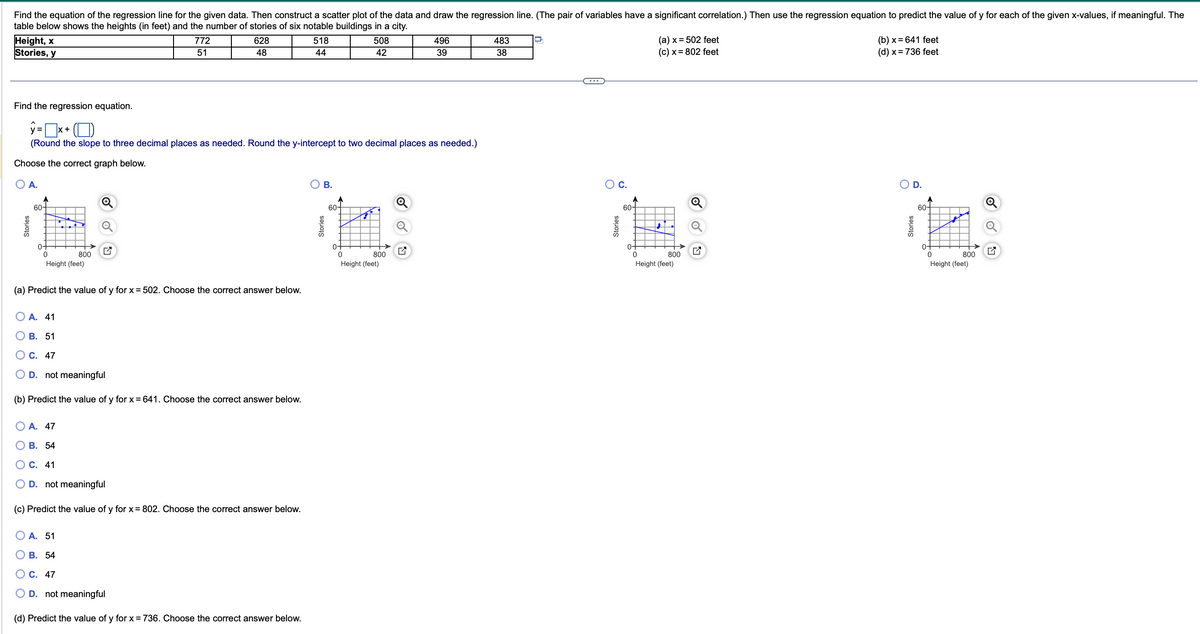

Transcribed Image Text:Find the equation of the regression line for the given data. Then construct a scatter plot of the data and draw the regression line. (The pair of variables have a significant correlation.) Then use the regression equation to predict the value of y for each of the given x-values, if meaningful. The
table below shows the heights (in feet) and the number of stories of six notable buildings in a city.
508
42
Height, x
Stories, y
Stories
A.
Find the regression equation.
y=x x +
(Round the slope to three decimal places as needed. Round the y-intercept to two decimal places as needed.)
Choose the correct graph below.
O
^
60-
0-
0
OA. 41
O
Height (feet)
800
(a) Predict the value of y for x = 502. Choose the correct answer below.
772
51
O A. 47
OB. 54
OC. 41
O D. not meaningful
628
48
B. 51
C. 47
O D. not meaningful
(b) Predict the value of y for x = 641. Choose the correct answer below.
O A. 51
B. 54
(c) Predict the value of y for x = 802. Choose the correct answer below.
518
44
OC. 47
OD. not meaningful
(d) Predict the value of y for x = 736. Choose the correct answer below.
B.
Stories
60-
0+
0
800
Height (feet)
Q
496
39
Q
483
38
C.
Stories
↑
60+
0-
0
(a) x = 502 feet
(c) x = 802 feet
800
Height (feet)
(b) x = 641 feet
(d) x = 736 feet
D.
60-
1:
800
Stories
0+
0
Height (feet)
Expert Solution
This question has been solved!
Explore an expertly crafted, step-by-step solution for a thorough understanding of key concepts.

Step by stepSolved in 3 steps with 1 images

Knowledge Booster

Similar questions
- Need regression equation, graph, and predict the value of y for a-d.arrow_forwardNeed regression equation, graph, and predict the value of y for a-d.arrow_forwardFind the equation of the regression line for the given data. Then construct a scatter plot of the data and draw the regression line. (The pair of variables have a significant correlation.) Then use the regression equation to predict the value of y for each of the given x-values, if meaningful. The table below shows the heights (in feet) and the numbe of stories of six notable buildings in a city. Height, x Stories, y 778 621 519 510 494 473 (a) x = 500 feet (c) x = 318 feet (b) x = 649 feet (d) x = 727 feet 51 47 45 41 38 36 Find the regression equation.arrow_forward
- Find the equation of the regression line for the given data. Then construct a scatter plot of the data and draw the regression line. (The pair of variables have a significant correlation.) Then use the regression equation to predict the value of y for each of the given x-values, if meaningful. The table below shows the heights (in feet) and the number of stories of six notable buildings in a city. 483 Height, x Stories, y 772 628 518 508 51 48 45 42 496 37 (a) x=499 feet (c) x=315 feet (b)x=639 feet (d) x = 732 feet 35 Find the regression equation. ŷ=x+ (Round the slope to three decimal places as needed. Round the y-intercept to two decimal places as needed.) Choose the correct graph below. O C. OB. O D. OA. Q Q ↓ 0 0 Height (feet) Height (feet) (a) Predict the value of y for x = 499. Choose the correct answer below. OA. 51 OB. 40 60+ 0- 800 60+ 0- 800 Q A 60- → 0 Height (feet) 800 60- 0- 800 0 Height (feet)arrow_forwardFind the equation of the regression line for the given data. Then construct a scatter plot of the data and draw the regression line. (The pair of variables have a significant correlation.) Then use the regression equation to predict the value of y for each of the given x-values, if meaningful. The table below shows the heights (in feet) and the number of stories of six notable buildings in a city. Helght, x Stories, y 775 53 619 47 519 44 508 41 491 39 474 37 (a) x= 499 feet (c) x 810 feet (b) x = 643 feet (d) x = 729 feet Find the regression equation. (Round the slope to three decimal places as needed. Round the y-intercept to two decimal places as needed.)arrow_forwardFind the equation of the regression line for the given data. Then construct a scatter plot of the data and draw the regression line. (The pair of variables have a significant correlation.) Then use the regression equation to predict the value of y for each of the given x-values, if meaningful. The table below shows the heights (in feet) and the number of stories of six notable buildings in a city. Height comma xHeight, x 766766 620620 520520 508508 494494 484484 (a) xequals=502502 feet (b) xequals=644644 feet Stories, y 5151 4646 4444 4141 3838 3636 (c) xequals=802802 feet (d) xequals=733733 feet Question content area bottom Part 1 Find the regression equation. ModifyingAbove y with caretyequals=enter your response herexplus+left parenthesis nothing right parenthesisenter your response here (Round the slope to three decimal places as needed. Round the y-intercept to two decimal places as needed.)arrow_forward
- Find the equation of the regression line for the given data. Then construct a scatter plot of the data and draw the regression line. (The pair of variables have a significant correlation.) Then use the regression equation to predict the value of y for each of the given x-values, if meaningful. The table below shows the heights (in feet) and the number of stories of six notable buildings in a city. Height, x Stories, y A 60- 0 775 53 Q 619 47 519 46 OB. 508 42 Find the regression equation. y = x+ (Round the slope to three decimal places as needed. Round the y-intercept to two decimal places as needed.) Choose the correct graph below. Q. A. 60 0 491 37 800 800 Height (feet) (n) Brodict the value of x for x=503. Choose the correct answer below. Height (feet) 474 36 D ... (a) x = 503 feet (c) x 310 feet OC. 800 0 Height (feet) Q www. (b)x=642 feet (d) x = 730 feet OD. 60- 0- 0 800 Height (feet)arrow_forwardNeed regression equation, graph, and predict the value of y for a-d.arrow_forwardFind the equation of the regression line for the given data. Then construct a scatter plot of the data and draw the regression line. (The pair of variables have a significant correlation.) Then use the regression equation to predict the value of y for each of the given x-values, if meaningful. The table below shows the heights (in feet) and the number of stories of six notable buildings in a city. Height, x Stories, y 762 621 515 508 491 480 (a) x = 499 feet (c) x= 318 feet (b) x=650 feet (d) x=732 feet 51 46 44 43 39 38arrow_forward
- Find the equation of the regression line for the given data. Then construct a scatter plot of the data and draw the regression line. (The pair of variables have a significant correlation.) Then use the regression equation to predict the value of y for each of the given x-values, if meaningful. The table below shows the heights (in feet) and the number of stories of six notable buildings in a city. Height, x Stories, y 519 (a) x = 500 feet (c) x = 810 feet (b) x = 649 feet (d) x = 732 feet 775 619 508 491 474 36 53 47 44 43 37 Find the regression equation. y=x+ O (Round the slope to three decimal places as needed. Round the y-intercept to two decimal places as needed.) Choose the correct graph below. OA. 60- 60- 60- 60- 800 Height (feet) 800 Height (feet) 800 Height (feet) Height (feet) (a) Predict the value of y for x = 500. Choose the correct answer below. A. 52 В. 40 C. 48 D. not meaningful (b) Predict the value of y for x = 649. Choose the correct answer below. A. 56 В. 48 O C. 40…arrow_forwardFind the equation of the regression line for the given data. Then construct a scatter plot of the data and draw the regression line. (The pair of variables have a significant correlation.) Then use the regression equation to predict the value of y for each of the given x-values, if meaningful. The table below shows the heights (in feet) and the number of stories of six notable buildings in a city. height 775 619 519 508 491 474 (a) x=503 feet (b) x=644 feet Stories, y 53 47 44 42 39 38 (c) x=798 feet (d) x=734 feetarrow_forwardFind the equation of the regression line for the given data. Then construct a scatter plot of the data and draw the regression line. (The pair of variables have a significant correlation.) Then use the regression equation to predict the value of y for each of the given x-values, if meaningful. The table below shows the heights (in feet) and the number of stories of six notable buildings in a city. Height, x Stories, y 762 51 621 46 515 45 508 42 491 39 480 36 (a) x = 502 feet (c) x = 315 feet Find the regression equation. ŷ=x+ (Round the slope to three decimal places as needed. Round the y-intercept to two decimal places as needed.) (b) x = 645 feet (d) x = 731 feetarrow_forward
arrow_back_ios
SEE MORE QUESTIONS
arrow_forward_ios
Recommended textbooks for you
- Glencoe Algebra 1, Student Edition, 9780079039897...AlgebraISBN:9780079039897Author:CarterPublisher:McGraw Hill
 Holt Mcdougal Larson Pre-algebra: Student Edition...AlgebraISBN:9780547587776Author:HOLT MCDOUGALPublisher:HOLT MCDOUGAL
 Algebra & Trigonometry with Analytic GeometryAlgebraISBN:9781133382119Author:SwokowskiPublisher:Cengage
  College Algebra (MindTap Course List)AlgebraISBN:9781305652231Author:R. David Gustafson, Jeff HughesPublisher:Cengage Learning
 Big Ideas Math A Bridge To Success Algebra 1: Stu...AlgebraISBN:9781680331141Author:HOUGHTON MIFFLIN HARCOURTPublisher:Houghton Mifflin Harcourt
Glencoe Algebra 1, Student Edition, 9780079039897...
Algebra
ISBN:9780079039897
Author:Carter
Publisher:McGraw Hill
Holt Mcdougal Larson Pre-algebra: Student Edition...
Algebra
ISBN:9780547587776
Author:HOLT MCDOUGAL
Publisher:HOLT MCDOUGAL
Algebra & Trigonometry with Analytic Geometry
Algebra
ISBN:9781133382119
Author:Swokowski
Publisher:Cengage
College Algebra (MindTap Course List)
Algebra
ISBN:9781305652231
Author:R. David Gustafson, Jeff Hughes
Publisher:Cengage Learning
Big Ideas Math A Bridge To Success Algebra 1: Stu...
Algebra
ISBN:9781680331141
Author:HOUGHTON MIFFLIN HARCOURT
Publisher:Houghton Mifflin Harcourt