
MATLAB: An Introduction with Applications
6th Edition
ISBN: 9781119256830
Author: Amos Gilat
Publisher: John Wiley & Sons Inc
expand_more
expand_more
format_list_bulleted
Related questions
Topic Video
Question
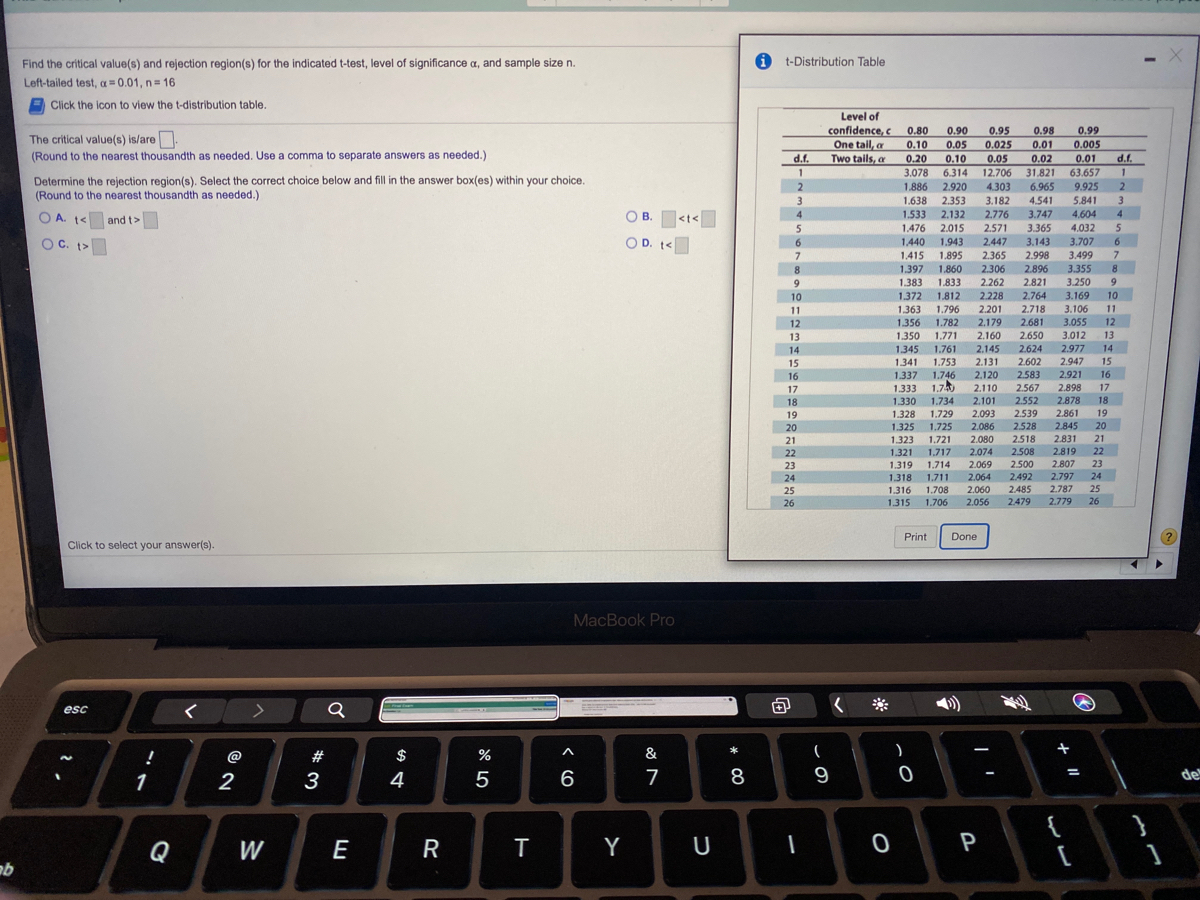

Transcribed Image Text:Find the critical value(s) and rejection region(s) for the indicated t-test, level of significance a, and sample size n.
i t-Distribution Table
Left-tailed test, a 0.01, n 16
A Click the icon to view the t-distribution table.
Level of
confidence, c 0.80
One tail, a
Two tails, a
0.90
0.95
0.025
0.98
0.99
The critical value(s) is/are.
(Round to the nearest thousandth as needed. Use a comma to separate answers as needed.)
0.10
0.05
0.01
0.005
d.f.
d.f.
0.20
3.078
0.10
0.05
0.02
0.01
1
6.314
12.706
31.821
63.657
1
Determine the rejection region(s). Select the correct choice below and fill in the answer box(es) within your choice.
(Round to the nearest thousandth as needed.)
2.
1.886 2.920
4.303
6.965
9.925
3
1,638
2.353
3.182
4.541
5.841
O B. <t<
O D. t<
O A. 1<
1.533
2.132
2.776
3.747
4.604
4
В.
4.
and t>
1.476
2.015
2.571
3.365
4.032
5
OC. t>
6.
1.440
1.943
2.447
3.143
3.707
6
1.415
1.895
2.365
2.998
3.499
7.
8.
1.397
1.860
2.306
2.896
3.355
8
9
1.383
1.833
2.262
2.821
3.250
1.812
2.228
2.201
2.179
10
1.372
2.764
3.169
10
1.796
1.782
11
1.363
2.718
3.106
11
12
1.356
2.681
3.055
12
13
1.350
1.771
2.160
2.650
3.012
13
14
1.345
1.761
2.145
2.624
2.977
14
15
1.341
1.753
2.131
2.602
2.947
15
1.337
16
1.746
1.70
1.734
1.729
2.120
2.583
2.921
2.898
2.878
2.861
16
2.110
17
1.333
1.330
2.567
2.552
17
18
2.101
18
19
1.328
2,093
2.539
19
20
1.325
1.725
2,086
2.528
2.845
20
21
1.323
1,721
2.080
2518
2.831
21
22
1.321
1.717
2.074
2.508
2.819
22
23
1.319
1.714
2.069
2500
2.807
23
24
1.318 1.711
2.064
2.492
2.797
24
2.060
2.485
2.787
25
25
26
1.316
1.708
1.315 1.706
2.056
2.479
2.779
26
Print
Done
Click to select your answer(s).
MacBook Pro
esc
@
#
$
&
*
3
4
6
7
8
9
de
{
Q
W
E
R
Y
U
P
-
Expert Solution
This question has been solved!
Explore an expertly crafted, step-by-step solution for a thorough understanding of key concepts.

This is a popular solution

Trending nowThis is a popular solution!

Step by stepSolved in 2 steps

Knowledge Booster


Learn more about
Need a deep-dive on the concept behind this application? Look no further. Learn more about this topic, statistics and related others by exploring similar questions and additional content below.Similar questions
- INFERENCE FOR SINGLE POPULATION PROPORTION (CONFIDENCE INTERVAL) 11. A random sample of 400 electronic components manufactured by a certain process is tested, and 30 are found to be defective. i. Let p be the proportion of defective components. Find a 95% confidence interval for p. ii. How many components must be sampled so that the 95% confidence interval will specify the proportion of defective components to within ±0.02? Source: Statistics for Engineers and Scientists, 3rd Edition, William, C. Navidi.arrow_forwardA survey was developed to estimate the average number of hours per week that adults spend exercising. Every third person entering a large fitness complex was surveyed, with a total of 2,500 people being surveyed. The data showed that the mean number of hours spent exercising was 3.2 hours per week. Which characteristic of the survey could create a bias in the results? The size of the sample The size of the sample The method of analyzing the data The method of analyzing the data The method of choosing the people who were surveyed The method of choosing the people who were surveyed The size of the populationarrow_forwardSample data were collected in a study of calcium supplements and their effects on blood pressure. A placebo group and a calcium group began the study with measures of blood pressures for each group. What test would be most appropriate, if you have non-normal data? Name of Test _____________________________________________arrow_forward
arrow_back_ios
arrow_forward_ios
Recommended textbooks for you
- MATLAB: An Introduction with ApplicationsStatisticsISBN:9781119256830Author:Amos GilatPublisher:John Wiley & Sons Inc
 Probability and Statistics for Engineering and th...StatisticsISBN:9781305251809Author:Jay L. DevorePublisher:Cengage Learning
 Statistics for The Behavioral Sciences (MindTap C...StatisticsISBN:9781305504912Author:Frederick J Gravetter, Larry B. WallnauPublisher:Cengage Learning
  Elementary Statistics: Picturing the World (7th E...StatisticsISBN:9780134683416Author:Ron Larson, Betsy FarberPublisher:PEARSON
 The Basic Practice of StatisticsStatisticsISBN:9781319042578Author:David S. Moore, William I. Notz, Michael A. FlignerPublisher:W. H. Freeman
 Introduction to the Practice of StatisticsStatisticsISBN:9781319013387Author:David S. Moore, George P. McCabe, Bruce A. CraigPublisher:W. H. Freeman
MATLAB: An Introduction with Applications
Statistics
ISBN:9781119256830
Author:Amos Gilat
Publisher:John Wiley & Sons Inc
Probability and Statistics for Engineering and th...
Statistics
ISBN:9781305251809
Author:Jay L. Devore
Publisher:Cengage Learning
Statistics for The Behavioral Sciences (MindTap C...
Statistics
ISBN:9781305504912
Author:Frederick J Gravetter, Larry B. Wallnau
Publisher:Cengage Learning
Elementary Statistics: Picturing the World (7th E...
Statistics
ISBN:9780134683416
Author:Ron Larson, Betsy Farber
Publisher:PEARSON
The Basic Practice of Statistics
Statistics
ISBN:9781319042578
Author:David S. Moore, William I. Notz, Michael A. Fligner
Publisher:W. H. Freeman
Introduction to the Practice of Statistics
Statistics
ISBN:9781319013387
Author:David S. Moore, George P. McCabe, Bruce A. Craig
Publisher:W. H. Freeman