
MATLAB: An Introduction with Applications
6th Edition
ISBN: 9781119256830
Author: Amos Gilat
Publisher: John Wiley & Sons Inc
expand_more
expand_more
format_list_bulleted
Related questions
Topic Video
Question
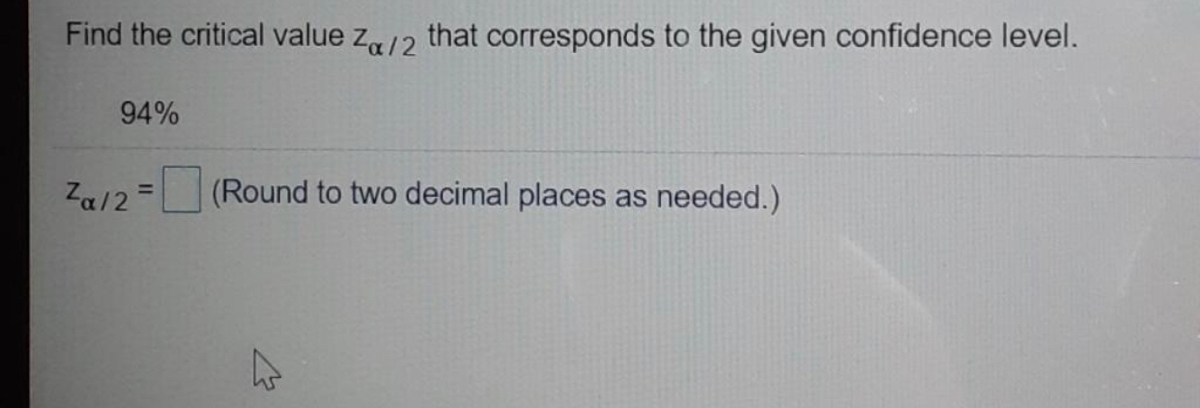

Transcribed Image Text:Find the critical value za/2 that corresponds to the given confidence level.
94%
Za/2 =
%3D
(Round to two decimal places as needed.)
Expert Solution
This question has been solved!
Explore an expertly crafted, step-by-step solution for a thorough understanding of key concepts.

This is a popular solution

Trending nowThis is a popular solution!

Step by stepSolved in 2 steps

Knowledge Booster


Learn more about
Need a deep-dive on the concept behind this application? Look no further. Learn more about this topic, statistics and related others by exploring similar questions and additional content below.Similar questions
- Construct a confidence interval for P1 - P2 at the given level of confidence. X1 = 26, n, = 236, x2 = 30, n2 = 304, 90% confidence %3D The researchers are% confident the difference between the two population proportions, p, - P2, is between and (Use ascending order. Type an integer or decimal rounded to three decimal places as needed.)arrow_forwardFind the critical value t, for the confidence level c = 0.99 and sample size n = 12. Click the icon to view the t-distribution table. (Round to the nearest thousandth as needed.) View an example Get more help - Help me solve thisarrow_forwardFrom a sample of 30 graduate students, the mean number of months of work experience prior to entering an MBA program was 33.93. The national standard deviation is known to be 17 months. What is a 90% confidence interval for the population mean? A 90% confidence interval for the population mean is || | (Use ascending order. Round to two decimal places as needed.) View an Example Get More Help - Clear All Check Answs Help Me Solve This earch acerarrow_forward
- es A sample of 12 fossil skeletons of an extinct species of bird has been collected. The mean length of the skulls in this sample is 5.29 cm and the standard deviation of the sample is 0.21 cm. Assuming that such measurements are normally distributed, find a 90% confidence interval for the population mean length of the skulls of this species of bird. You may want to use one of these: qt (p-0.10, df-11, lower. tail-FALSE)=1.36343 qt(p-0.05, df-11, lower.tail-FALSE) =1.795885 qnorm(0.10, mean-0, sd-1, lower.tail-FALSE)=1.281552 qnorm(0.05, mean-0, sd-1, lower.tail=FALSE)=1.644854 O (4.945, 5.635) O (4.913, 5.667) O (5.021, 5.559) O (5.181, 5.399)arrow_forwardK Find the critical value Za/2 that corresponds to the confidence level 85%. Zal2 = (Round to two decimal places as needed.) Carrow_forwardConstruct a confidence interval for p, - P, at the given level of confidence. X1 = 34, n1 = 273, x2 = 32, n2 = 313, 90% confidence The researchers are % confident the difference between the two population proportions, p, - P2, is between and (Use ascending order. Type an integer or decimal rounded to three decimal places as needed.)arrow_forward
- Round to three decimal places. For a confidence level of 99%, find the critical zarrow_forwardScore: 30.8/100 7/16 answered Question 6 く> In a recent poll, 590 people were asked if they liked dogs, and 70% said they did. Find the Margin of Error for this poll, at the 90% confidence level. Give your answer to four decimal places if possible. Submit Question MacBookarrow_forwardConstruct a confidence interval of the population proportion at the given level of confidence. x=860, n = 1200, 95% confidence Click here to view the standard normal distribution table (page 1). Click here to view the standard normal distribution table (page 2). BENGKE 202 The lower bound of the confidence interval is 691 (Round to three decimal places as needed.) The upper bound of the confidence interval is (Round to three decimal places as needed.) CON SEME ++ d kepad DAPA ...arrow_forward
arrow_back_ios
arrow_forward_ios
Recommended textbooks for you
- MATLAB: An Introduction with ApplicationsStatisticsISBN:9781119256830Author:Amos GilatPublisher:John Wiley & Sons Inc
 Probability and Statistics for Engineering and th...StatisticsISBN:9781305251809Author:Jay L. DevorePublisher:Cengage Learning
 Statistics for The Behavioral Sciences (MindTap C...StatisticsISBN:9781305504912Author:Frederick J Gravetter, Larry B. WallnauPublisher:Cengage Learning
  Elementary Statistics: Picturing the World (7th E...StatisticsISBN:9780134683416Author:Ron Larson, Betsy FarberPublisher:PEARSON
 The Basic Practice of StatisticsStatisticsISBN:9781319042578Author:David S. Moore, William I. Notz, Michael A. FlignerPublisher:W. H. Freeman
 Introduction to the Practice of StatisticsStatisticsISBN:9781319013387Author:David S. Moore, George P. McCabe, Bruce A. CraigPublisher:W. H. Freeman
MATLAB: An Introduction with Applications
Statistics
ISBN:9781119256830
Author:Amos Gilat
Publisher:John Wiley & Sons Inc
Probability and Statistics for Engineering and th...
Statistics
ISBN:9781305251809
Author:Jay L. Devore
Publisher:Cengage Learning
Statistics for The Behavioral Sciences (MindTap C...
Statistics
ISBN:9781305504912
Author:Frederick J Gravetter, Larry B. Wallnau
Publisher:Cengage Learning
Elementary Statistics: Picturing the World (7th E...
Statistics
ISBN:9780134683416
Author:Ron Larson, Betsy Farber
Publisher:PEARSON
The Basic Practice of Statistics
Statistics
ISBN:9781319042578
Author:David S. Moore, William I. Notz, Michael A. Fligner
Publisher:W. H. Freeman
Introduction to the Practice of Statistics
Statistics
ISBN:9781319013387
Author:David S. Moore, George P. McCabe, Bruce A. Craig
Publisher:W. H. Freeman