
A First Course in Probability (10th Edition)
10th Edition
ISBN: 9780134753119
Author: Sheldon Ross
Publisher: PEARSON
expand_more
expand_more
format_list_bulleted
Related questions
Question

Transcribed Image Text:**Calculating Critical Value for Confidence Interval**
To calculate the critical value \( z_c \) necessary to form a confidence interval at the specified level of confidence, follow the steps outlined below.
---
**Problem Statement:**
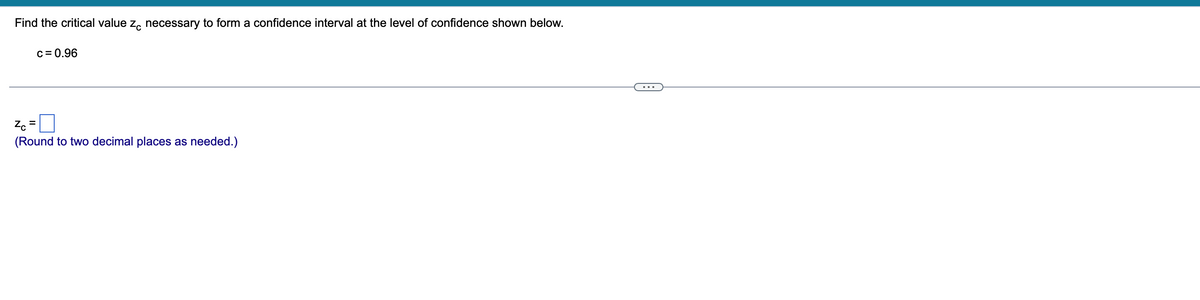
Find the critical value \( z_c \) necessary to form a confidence interval at the level of confidence shown below:
- \( c = 0.96 \)
**Calculation:**
\( z_c = \underline{\hspace{3cm}} \)
*Note: Please round your answer to two decimal places if necessary.*
---
**Explanation:**
The critical value \( z_c \) can be found using the standard normal distribution table or a statistical calculator that provides the critical z-value for a given confidence level. The confidence level \( c \) denotes the probability that the true parameter lies within the confidence interval. For this problem, \( c = 0.96 \), which means we want to find the z-value where the area under the standard normal curve is 0.96.
Use the z-table to find the z-score corresponding to an area of \( \frac{1 + c}{2} \), which would be \( \frac{1 + 0.96}{2} = 0.98 \). Once you locate 0.98 in the z-table, the z-value corresponding to that area is the critical value \( z_c \).
Expert Solution
This question has been solved!
Explore an expertly crafted, step-by-step solution for a thorough understanding of key concepts.

Step by stepSolved in 2 steps

Knowledge Booster

Similar questions
- Determine the t-value in each of the cases Find the t-value that corresponds to building a 90% confidence interval. Assume 11 degrees of freedom. (Round to three decimal places as needed.)arrow_forwardFind the critical value z, necessary to form a confidence interval at the level of confidence shown below. c= 0.91 1.70 (Round to two decimal places as needed.)arrow_forwardFind the critical value z, necessary to form a confidence interval at the level of confidence shown below. c = 0.89 (Round to two decimal places as needed.)arrow_forward
- Assume that we want to construct a confidence interval. Do one of the following, as appropriate: (a) find the critical value tα/2, (b) find the critical value zα/2, or (c) state that neither the normal distribution nor the t distribution applies. The confidence level is 95%, σ is not known, and the histogram of 61 player salaries (in thousands of dollars) of football players on a team is as shown. 040008000120001600020000010203040Salary (thousands of dollars)Frequency A histogram has a horizontal axis labeled "Salary (thousands of dollars)" from below 0 to above 20000 in increments of 2000 and a vertical axis labeled "Frequency" from 0 to 40 in increments of 10. The histogram contains vertical bars of width 2000, where one vertical bar is centered over each of the horizontal axis tick marks. The heights of the vertical bars are as follows, where the salary is listed first and the height is listed second: 0, 34; 2000, 16; 4000,…arrow_forwardFor a confidence level of 99% and n = 18, find the critical value Xfa/2.n-1 with the table. (Use four digits after the decimal point, e.g. 0.12) Type your answer.arrow_forwardFind the critical value zc necessary to form a confidence interval at the level of confidence shown below. c=0.82 zc= (Round to two decimal places as needed.)arrow_forward
- Find the critical value zc necessary to form a confidence interval at the level of confidence shown below. c=0.92 zc=arrow_forwardAssume that we want to construct a confidence interval. Do one of the following, as appropriate: (a) find the critical value tα/2, (b) find the critical value zα/2, or (c) state that neither the normal distribution nor the t distribution applies. The confidence level is 90%, σ is not known, and the normal quantile plot of the 17 salaries (in thousands of dollars) of basketball players on a team is as shown.arrow_forwardIf n=29, (x-bar)3D46, and s=7, construct a confidence interval at a 95% confidence level. Assume the data came from a normally distributed population. Give your answers to one decimal place. < µ <arrow_forward
arrow_back_ios
arrow_forward_ios
Recommended textbooks for you
- A First Course in Probability (10th Edition)ProbabilityISBN:9780134753119Author:Sheldon RossPublisher:PEARSON

A First Course in Probability (10th Edition)
Probability
ISBN:9780134753119
Author:Sheldon Ross
Publisher:PEARSON