
MATLAB: An Introduction with Applications
6th Edition
ISBN: 9781119256830
Author: Amos Gilat
Publisher: John Wiley & Sons Inc
expand_more
expand_more
format_list_bulleted
Related questions
Question
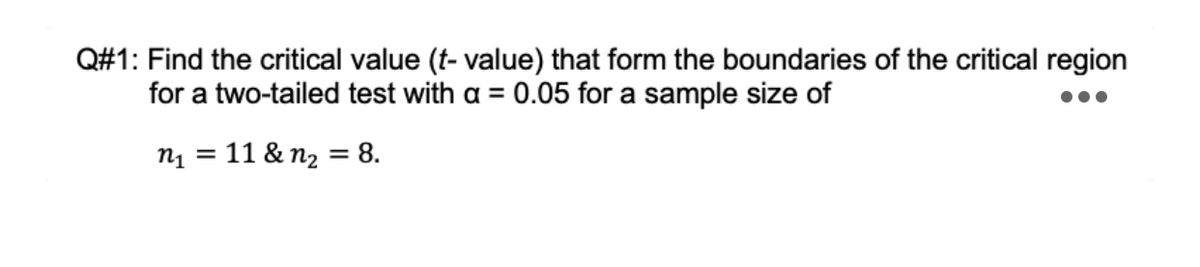

Transcribed Image Text:Q#1: Find the critical value (t- value) that form the boundaries of the critical region
for a two-tailed test with a = 0.05 for a sample size of
nį = 11 & n2 = 8.
%3D
Expert Solution
This question has been solved!
Explore an expertly crafted, step-by-step solution for a thorough understanding of key concepts.

This is a popular solution

Trending nowThis is a popular solution!

Step by stepSolved in 2 steps with 2 images

Knowledge Booster

Similar questions
- also z test and p valuearrow_forwardFind the critical value and rejection region for the type of t-test with level of significance a and sample size n. Left tailed test a=0.01, n=36arrow_forwardA sample of n = 16 individuals participates in a repeated-measures study that produces a sample mean difference of 9 with SSD = 960. Calculate the variance for the sample of difference scores. Calculate the estimated standard error for the sample mean difference.arrow_forward
- For the Kruskal-Wallis ANOVA: Is there a statistical difference between the rankings of the core temperatures of the groups exposed to either a cold, neutral, or hot environment? (smaller number= coldest core temperature ranking, largest number= hottest core temperature ranking).” Ranks that are tied, get an average value of the two ranks. The Data is attached. Thank you.arrow_forwardPlease help! I need this to graduate, thank you so much.arrow_forwardThe Paleo diet allows only for foods that humans typically consumed over the last 2.5 million years, excluding those agriculture-type foods that arose during the last 10,000 years or so. Researchers randomly divided 500 volunteers into two equal-sized groups. One group spent 6 months on the Paleo diet. The other group received a pamphlet about controlling portion sizes. A randomized treatment assignment was performed, and at the beginning of the study, the average difference in weights between the two groups was about 0 pounds. After the study, the Paleo group had lost an average of 7.1 pounds with a standard deviation of 22.75 pounds while the control group had lost an average of 4.5 pounds with a standard deviation of 11.5 pounds. After failing to reject the null hypothesis support your answer with a p-value (a) P-value = _______arrow_forward
- A traffic safety company publishes reports about motorcycle fatalities and helmet use. In the first accompanying data table, the distribution shows the proportion of fatalities by location of injury for motorcycle accidents. The second data table shows the location of injury and fatalities for 2073 riders not wearing a helmet. Complete parts (a) and (b) below. (a) Does the distribution of fatal injuries for riders not wearing a helmet follow the distribution for all riders? Use α = 0.10 level of significance. What are the null and alternative hypotheses? A. Ho: The distribution of fatal injuries for riders not wearing a helmet follows the same distribution for all other riders. H₁: The distribution of fatal injuries for riders not wearing a helmet does not follow the same distribution for all other riders. B. Ho: The distribution of fatal injuries for riders not wearing a helmet does not follow the same distribution for all other riders. H₁: The distribution of fatal injuries for…arrow_forwardA researcher is studying how much electricity (in kilowatt hours) people from two different cities use in their homes. Random samples of 13 days from Nashville (Group 1) and 14 days from Cincinnati (Group 2) are shown below. Test the claim that the mean number of kilowatt hours in Nashville is less than the mean number of kilowatt hours in Cincinnati. Use a significance level of a = 0.10. Assume the populations are approximately normally distributed with unequal variances. Round answers to 4 decimal places. Nashville Cincinnati 902.6 892.9 904.9 897.5 905.2 904.1 911.4 883.9 898.7 887.7 889.7 907.2 899.1 Ho: M₁ What are the correct hypotheses? Note this may view better in full screen mode. Select the correct symbols for each of the 6 spaces. 921.2 931.1 908.3 939.6 898 934.6 906.6 921.2 907.5 902.4 883.6 893.1 Test Statistic = 941.4 923.6 p-value = H₁: M₁ Based on the hypotheses, find the following: H₁₂ H₂ Orarrow_forwardA researcher decides to measure anxiety in group of bullies and a group of bystanders using a 23-item, 3 point anxiety scale. Assume scores on the anxiety scales are normally distributed and the variance among the group of bullies and bystanders are the same. A group of 30 bullies scores an average of 21.5 with a sample standard deviation of 10 on the anxiety scale. A group of 27 bystanders scored an average of 25.8 with a sample standard deviation of 8 on the anxiety scale. You do not have any presupposed assumptions whether bullies or bystanders will be more anxious so you formulate the null and alternative hypothesis based on that.arrow_forward
arrow_back_ios
arrow_forward_ios
Recommended textbooks for you
- MATLAB: An Introduction with ApplicationsStatisticsISBN:9781119256830Author:Amos GilatPublisher:John Wiley & Sons Inc
 Probability and Statistics for Engineering and th...StatisticsISBN:9781305251809Author:Jay L. DevorePublisher:Cengage Learning
 Statistics for The Behavioral Sciences (MindTap C...StatisticsISBN:9781305504912Author:Frederick J Gravetter, Larry B. WallnauPublisher:Cengage Learning
  Elementary Statistics: Picturing the World (7th E...StatisticsISBN:9780134683416Author:Ron Larson, Betsy FarberPublisher:PEARSON
 The Basic Practice of StatisticsStatisticsISBN:9781319042578Author:David S. Moore, William I. Notz, Michael A. FlignerPublisher:W. H. Freeman
 Introduction to the Practice of StatisticsStatisticsISBN:9781319013387Author:David S. Moore, George P. McCabe, Bruce A. CraigPublisher:W. H. Freeman
MATLAB: An Introduction with Applications
Statistics
ISBN:9781119256830
Author:Amos Gilat
Publisher:John Wiley & Sons Inc
Probability and Statistics for Engineering and th...
Statistics
ISBN:9781305251809
Author:Jay L. Devore
Publisher:Cengage Learning
Statistics for The Behavioral Sciences (MindTap C...
Statistics
ISBN:9781305504912
Author:Frederick J Gravetter, Larry B. Wallnau
Publisher:Cengage Learning
Elementary Statistics: Picturing the World (7th E...
Statistics
ISBN:9780134683416
Author:Ron Larson, Betsy Farber
Publisher:PEARSON
The Basic Practice of Statistics
Statistics
ISBN:9781319042578
Author:David S. Moore, William I. Notz, Michael A. Fligner
Publisher:W. H. Freeman
Introduction to the Practice of Statistics
Statistics
ISBN:9781319013387
Author:David S. Moore, George P. McCabe, Bruce A. Craig
Publisher:W. H. Freeman