MATLAB: An Introduction with Applications
6th Edition
ISBN: 9781119256830
Author: Amos Gilat
Publisher: John Wiley & Sons Inc
expand_more
expand_more
format_list_bulleted
Concept explainers
Question

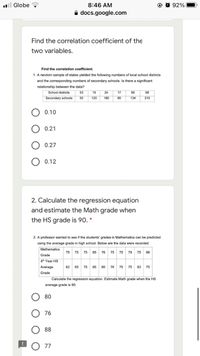
Transcribed Image Text:l Globe
8:46 AM
92%
A docs.google.com
Find the correlation coefficient of the
two variables.
Find the correlation coefficient.
1. A random sample of states yielded the following numbers of local school districts
and the corresponding numbers of secondary schools. Is there a significant
relationship between the data?
School districts
53
19
24
17
95
68
Secondary schools
50
120
180
80
134
210
0.10
0.21
0.27
0.12
2. Calculate the regression equation
and estimate the Math grade when
the HS grade is 90. *
2. A professor wanted to see if the students' grades in Mathematics can be predicted
using the average grade in high school. Below are the data were recorded.
Mathematics
75
75 75 85 76 75 75 79
75 88
Grade
4h Year HS
Average
82 65 75 85
80 76 75 75 83 75
Grade
Calculate the regression equation. Estimate Math grade when the HS
average grade is 90.
80
76
88
77

Transcribed Image Text:l Globe
8:46 AM
92%
A docs.google.com
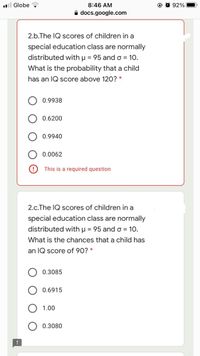
2.b.The IQ scores of children in a
special education class are normally
distributed with µ = 95 and o = 10.
What is the probability that a child
has an IQ score above 120? *
0.9938
0.6200
0.9940
0.0062
This is a required question
2.c.The IQ scores of children in a
special education class are normally
distributed with µ = 95 and o = 10.
What is the chances that a child has
an IQ score of 90? *
0.3085
0.6915
1.00
0.3080
Expert Solution
This question has been solved!
Explore an expertly crafted, step-by-step solution for a thorough understanding of key concepts.
Step by stepSolved in 2 steps with 1 images

Knowledge Booster
Learn more about
Need a deep-dive on the concept behind this application? Look no further. Learn more about this topic, statistics and related others by exploring similar questions and additional content below.Similar questions
- use the sample data to construct a scatterplot. Use the first variable for the x-axis. Based on the scatterplot, what do you conclude about a linear correlation? FORECAST AND ACTUAL TEMPERATURES The table lists actual high temperatures and the high temperatures that were previously forecasted for these same days. The table includes data for ten different days near the author’s home. What does the result suggest about the accuracy of five-day predicted high temperatures?arrow_forwardd) Correlation by eye Sample size=45 y 20- 15- og 8. 10- 5. 10 15 20 25 X Try to guess the sample correlation within +/- 0.1 Guess: Correlation: Sample coeficient of correlation a o 00 00arrow_forwardStatistics Questionarrow_forward
- 35arrow_forwardAssume that you have paired values consisting of heights (in inches) and weights (in lb) from 40 randomly selected men. The linear correlation coefficient r is 0.567. Find the value of the coefficient of determination. What practical information does the coefficient of determination provide? Question content area bottom Part 1 Choose the correct answer below. A. The coefficient of determination is 0.321. 32.1% of the variation is explained by the linear correlation, and 67.9% is explained by other factors. B. The coefficient of determination is 0.679. 67.9% of the variation is explained by the linear correlation, and 32.1% is explained by other factors. C. The coefficient of determination is 0.321. 67.9% of the variation is explained by the linear correlation, and 32.1% is explained by other factors. D. The coefficient of determination is 0.679. 32.1% of the variation is explained by the linear correlation, and 67.9% is…arrow_forwardFind the sample correlation coefficient for the following data.arrow_forward
- Answer question 4. Thanks!arrow_forwardfill in the blank pls!arrow_forwardSample grade point averages for ten male students and ten female students are listed. Find the coefficient of variation for each of the two data sets. Then compare the results. Males 2.3 3.8 3.9 3.7 2.6 2.4 3.6 3.2 3.9 1.8 Females 2.7 3.6 2.2 3.9 3.7 4.2 1.9 3.9 3.6 2.1 ... The coefficient of variation for males is %. (Round to one decimal place as needed.) The coefficient of variation for females is %. (Round to one decimal place as needed.) Compare the variability of grade point averages of males and females. Choose the correct answer below. O A. The grade point averages of females and males have the same variation. O B. The grade point averages of males are more variable than females. O C. The grade point averages of females and males do not vary. O D. The grade point averages of females are more variable than males.arrow_forward
- OA. Tip Amount ($) Construct a scatterplot. Choose the correct graph below. 25- The table below includes data from taxi rides. The distances are in miles, the times are in minutes, the fares are in dollars, and the tips are in dollars. Is there sufficient evidence to conclude that there is a linear correlation between the time of the ride and the tip amount? Construct a scatterplot, find the value of the linear correlation coefficient r, and find the P-value of r. Determine whether there is sufficient evidence to support a claim of linear correlation between the two variables. Use a significance level of a 0.01. Does it appear that riders base their tips on the time of the ride? Click here for information on the taxi rides. 0 35 Ride time (minutes) Determine the linear correlation coefficient. The linear correlation coefficient is r= (Round to three decimal places as needed.) Tip Amount ($) B. Q 25- Q 0- 0 35 Ride time (minutes) Tip Amount ($) C. 25- Q 0 35 G Ride time (minutes) O D.…arrow_forwardA random sample of ten professional athletes produced the following data. The first row is the number of endorsements the athlete has and the second row is the amount of money made (in millions of dollars) by the athlete. What is the linear correlation coefficient? Round to three decimal places. Number of Endorsements 0 3 2 1 5 5 4 3 0 4 Profit (in Millions) 2 8 7 3 13 12 9 9 3 10arrow_forwardConsider the relationship between the number of bids an item on eBay received and the item's selling price. The following is a sample of 5 items sold through an auction. Price in Dollars 29 35 41 44 47 Number of Bids 10 11 12 13 14 Step 2 of 3: Estimate the correlation in words: positive, negative, no correlation. Copy Dataarrow_forward
arrow_back_ios
SEE MORE QUESTIONS
arrow_forward_ios
Recommended textbooks for you
 MATLAB: An Introduction with ApplicationsStatisticsISBN:9781119256830Author:Amos GilatPublisher:John Wiley & Sons Inc
 Probability and Statistics for Engineering and th...StatisticsISBN:9781305251809Author:Jay L. DevorePublisher:Cengage Learning
 Statistics for The Behavioral Sciences (MindTap C...StatisticsISBN:9781305504912Author:Frederick J Gravetter, Larry B. WallnauPublisher:Cengage Learning
 Elementary Statistics: Picturing the World (7th E...StatisticsISBN:9780134683416Author:Ron Larson, Betsy FarberPublisher:PEARSON
 The Basic Practice of StatisticsStatisticsISBN:9781319042578Author:David S. Moore, William I. Notz, Michael A. FlignerPublisher:W. H. Freeman
 Introduction to the Practice of StatisticsStatisticsISBN:9781319013387Author:David S. Moore, George P. McCabe, Bruce A. CraigPublisher:W. H. Freeman

MATLAB: An Introduction with Applications
Statistics
ISBN:9781119256830
Author:Amos Gilat
Publisher:John Wiley & Sons Inc

Probability and Statistics for Engineering and th...
Statistics
ISBN:9781305251809
Author:Jay L. Devore
Publisher:Cengage Learning

Statistics for The Behavioral Sciences (MindTap C...
Statistics
ISBN:9781305504912
Author:Frederick J Gravetter, Larry B. Wallnau
Publisher:Cengage Learning

Elementary Statistics: Picturing the World (7th E...
Statistics
ISBN:9780134683416
Author:Ron Larson, Betsy Farber
Publisher:PEARSON

The Basic Practice of Statistics
Statistics
ISBN:9781319042578
Author:David S. Moore, William I. Notz, Michael A. Fligner
Publisher:W. H. Freeman

Introduction to the Practice of Statistics
Statistics
ISBN:9781319013387
Author:David S. Moore, George P. McCabe, Bruce A. Craig
Publisher:W. H. Freeman