
MATLAB: An Introduction with Applications
6th Edition
ISBN: 9781119256830
Author: Amos Gilat
Publisher: John Wiley & Sons Inc
expand_more
expand_more
format_list_bulleted
Related questions
Question
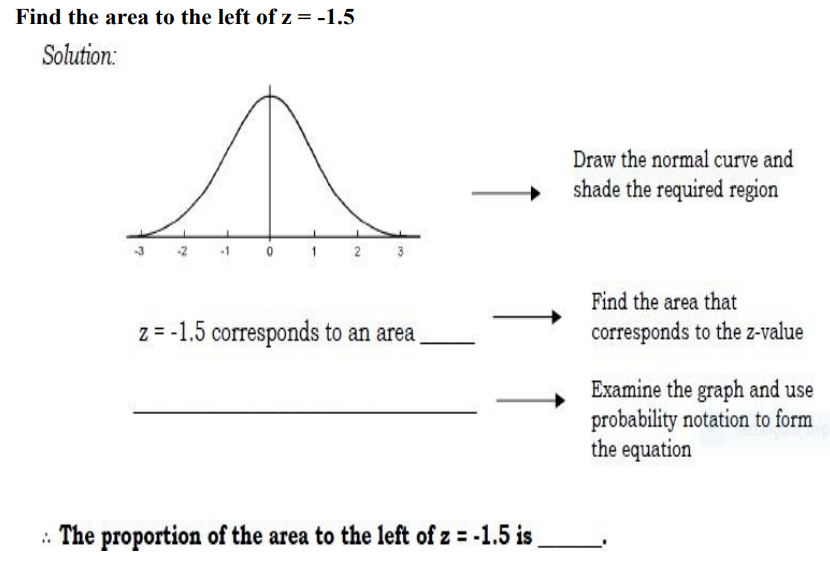

Transcribed Image Text:Find the area to the left of z = -1.5
Solution:
Draw the normal curve and
shade the required region
2 3
Find the area that
z = -1.5 corresponds to an area
corresponds to the z-value
Examine the graph and use
probability notation to form
the equation
. The proportion of the area to the left of z = -1.5 is

Transcribed Image Text:Table I: Table of Areas under the Normal Curve
06|
.00
.01
.02
.03
.04
.05
.07
.08
.09
0.0
.0000
.0040
.00so
.0120
.0150
.0199
.0239
.0279
.0319
.0359
0.1
.0398
.0438
.0478
.0517
.0557
.0596
.0636
.0675
.0714 .0754
0.2
.0793
.0832
.0871
.0910
.0948
.0987
1026
.1064
.1103.1141
0.3
.1179
.1217
.1253
.1293
.1331
.1368
.1406
.1443
.1480
.1517
0.4
.1554
.1591
.1628
.1664
.1700
.1736
.1772
.1808
.1844
.1879
0.5
.1915
.1950
.1985
.2019
.2054
.2088
.2123
.2157
.2190
.2224
0.6
.2258
.2291
.2324
.2357
2389
.2422
.2454
2486
.2518
.2549
0.7
2580
.2612
.2642
.2673
.2704
.2734
.2764
.2794
.2823
.2852
0.8
2881
.2910
.2939
.2967
2996
.3023
3051
.3078
.3106
.3133
0.9
3159
.3186
.3212
3288
3264
.3289
.3315
.3340
.3365
3389
1.0
3413
.3438
.3461
.3485
.3508
.3531
.3554
.3557
.3559 .3621
.3810 .3830
.3997 4015
1.1
.3642
.3665
.3686
.3708
.3729
.3749
.3770
.3790
1.2
.3849
.3869
.3888
.3907
.3925
.3944
.3962
.3980
1.3
4032
.4049
.4066
.4082
4099
.4115
4131
.4147
.4162 .4177
1.4
4192
.4207
.4222
4236
4251
.4265
4279
.4292
.4306
.4319
1.5
.4332
.4345
.4357
.4370
4382
.4394
.4406
.4418
.4429 .4441
1.6
.4452
.4463
.4474
.4484
4495
.4505
4515
4525
.4535 .4545
1.7
4554
.4564
.4573
.4582
4591
.4599
.4608
.4616
.4625 .4633
1.8
4641
.4649
.4656
4664
4671
.4678
4686
.4693
.4699
4706
1.9
4713
.4719
.4726
.4732
4738
.4744
.4750
.4756
.4761
.4767
2.0
4772
.4778
.4783
.4788
.4793
.4798
4803
.4808
.4812 .4817
2.1
4821
.4826
.4830
.4834
4838
.4842
4846
4850
.4854
.4857
22
4861
.4864
.4868
.4871
.4875
.4878
4881
.4884
.4887
.4890
23
.4893
.4896
.4898
.4901
4904
.4906
4909
.4911
.4913
.4916
2.4
.4918
.4920
.4922
.4925
4927
.4929
4931
.4932
.4934
.4936
2.5
4938
.4940
.4941
.4943
4945
.4946
4948
.4949
.4951
.4952
2.6
4953
.4955
.4956
.4957
4959
.4960
.4961
.4962
.4963
.4964
2.7
4965
.4966
.4967
.4968
4969
.4970
4971
4972
.4973
.4974
2.8
.4974
.4975
.4976
.4977
4977
.4978
4979
.4979
.4980
.4981
2.9
.4981
.4982
.4982
.4983
4984
.4984
.4985
.4985
.4986
.4986
3.0
.4987
.4987
.4987
.4988
4988
.4989
.4989
.4989
.4990
.4990
For values of z above 3.09, use 0.4999
en +
Expert Solution
This question has been solved!
Explore an expertly crafted, step-by-step solution for a thorough understanding of key concepts.

This is a popular solution

Trending nowThis is a popular solution!

Step by stepSolved in 2 steps with 1 images

Knowledge Booster

Similar questions
- Find the data value is Z = 1.6, µ= 30, σ = 2.4 Write the data value rounded to 2 decimal places. Ili SAMSUNGarrow_forwardH0: P=0.18 Ha: p=/ 0.18 a= 0.10 p-hat= 0.23 n=200 z- score = 1.84 whats the p-valuearrow_forward%3D A population of N= 5 scores has EX= 20 and EX² = 100. For this population, what is the value of SS?arrow_forward
- Can balloons hold more air or more water before bursting? A student purchased a large bag of 12-inch balloons. He randomly selected 10 balloons from the bag and then randomly assigned half of them to be filled with air until bursting and the other half to be filled with water until bursting. He used devices to measure the amount of air and water was dispensed until the balloons burst. Here are the dataarrow_forwardlecture(12.2): A statistic class is made up of 28 students online and 21 students in person. What proportion of the class is learning online?. Round your answer to 2 decimal placesarrow_forwardHey! I need help with #17, thank you!arrow_forward
- z score area between -1.425 and 1.425 find out shaded area of given data and also find probability in percentagearrow_forwardH.: µ = 47.6 and H, : µ < 47.6 where u = the mean age of teachers at Ravenwood High School. The calculated p-value is 0.023. What conclusion will you make at a = 0.10? O Reject the H. O Fail to reject the H. O Reject the H. O Fail to reject the Haarrow_forwardCoefficient of variation is measure of dispersion. Select one: a. absolute b. relative C. Both of these d. none of thesearrow_forward
arrow_back_ios
arrow_forward_ios
Recommended textbooks for you
- MATLAB: An Introduction with ApplicationsStatisticsISBN:9781119256830Author:Amos GilatPublisher:John Wiley & Sons Inc
 Probability and Statistics for Engineering and th...StatisticsISBN:9781305251809Author:Jay L. DevorePublisher:Cengage Learning
 Statistics for The Behavioral Sciences (MindTap C...StatisticsISBN:9781305504912Author:Frederick J Gravetter, Larry B. WallnauPublisher:Cengage Learning
  Elementary Statistics: Picturing the World (7th E...StatisticsISBN:9780134683416Author:Ron Larson, Betsy FarberPublisher:PEARSON
 The Basic Practice of StatisticsStatisticsISBN:9781319042578Author:David S. Moore, William I. Notz, Michael A. FlignerPublisher:W. H. Freeman
 Introduction to the Practice of StatisticsStatisticsISBN:9781319013387Author:David S. Moore, George P. McCabe, Bruce A. CraigPublisher:W. H. Freeman
MATLAB: An Introduction with Applications
Statistics
ISBN:9781119256830
Author:Amos Gilat
Publisher:John Wiley & Sons Inc
Probability and Statistics for Engineering and th...
Statistics
ISBN:9781305251809
Author:Jay L. Devore
Publisher:Cengage Learning
Statistics for The Behavioral Sciences (MindTap C...
Statistics
ISBN:9781305504912
Author:Frederick J Gravetter, Larry B. Wallnau
Publisher:Cengage Learning
Elementary Statistics: Picturing the World (7th E...
Statistics
ISBN:9780134683416
Author:Ron Larson, Betsy Farber
Publisher:PEARSON
The Basic Practice of Statistics
Statistics
ISBN:9781319042578
Author:David S. Moore, William I. Notz, Michael A. Fligner
Publisher:W. H. Freeman
Introduction to the Practice of Statistics
Statistics
ISBN:9781319013387
Author:David S. Moore, George P. McCabe, Bruce A. Craig
Publisher:W. H. Freeman