
MATLAB: An Introduction with Applications
6th Edition
ISBN: 9781119256830
Author: Amos Gilat
Publisher: John Wiley & Sons Inc
expand_more
expand_more
format_list_bulleted
Related questions
Question
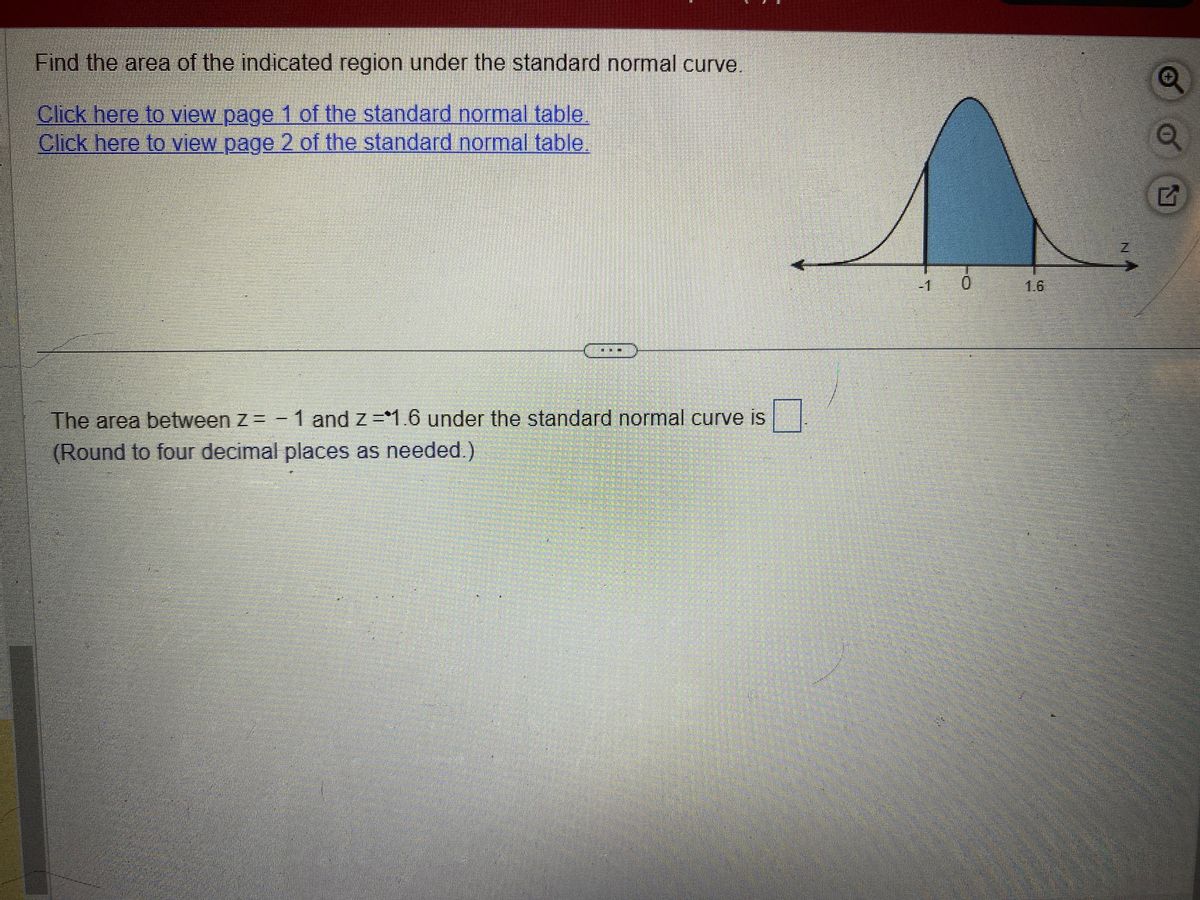

Transcribed Image Text:Find the area of the indicated region under the standard normal curve.
Click here to view page 1 of the standard normal table.
Click here to view page 2 of the standard normal table.
The area between z = -1 and z=1.6 under the standard normal curve is
(Round to four decimal places as needed.)
T
G
Expert Solution
This question has been solved!
Explore an expertly crafted, step-by-step solution for a thorough understanding of key concepts.

Step by stepSolved in 3 steps with 1 images

Knowledge Booster

Similar questions
- You are conducting a test of independence for the claim that two different populations have the same proportions of the following two characteristics. Here is the sample data. Population Population #1 Category #2 A 43 33 В 32 18 The expected frequencies for this table would be Population Population #1 Category #2 A В What is the chi-square test-statistic for this data? Report all answers accurate to three decimal places.arrow_forwardArea under the standard normal distribution to the left of Z (page 2) D Z 0.0 0.1 0.2 0.3 0.4 0.5 0.6 0.7 0.8 0.9 1.0 1.1 1.2 1.3 1.4 1.5 1.6 1.7 1.8 1.9 2.0 .09 .00 .01 .02 .03 .04 .05 .06 .07 .08 5000 .5040 .5080 5120 5160 .5199 5239 5279 5319 .5359 5398 .5438 .5478 .5517 5557 .5596 .5636 5675 5714 .5753 5793 .5832 .5871 5910 5948 5987 .6026 .6064 .6103 .6141 .6179 .6217 .6255 .6293 .6331 .6368 .6406 .6443 .6480 .6517 .6554 .6591 .6628 .6664 .6700 .6736 .6772 .6808 .6844 .6879 .6915 .6950 .6985 .7019 .7054 .7088 .7123 .7157 .7190 .7224 .7257 .7291 .7324 .7357 .7389 .7422 .7454 .7486 .7517 .7549 .7580 .7611 .7642 .7673 .7704 .7734 .7764 7794 .7823 .7852 .7881 .7910 .7939 .7967 .7995 .8023 .8051 .8078 .8106 .8133 .8159 .8186 .8212 8238 .8264 .8289 .8315 .8340 .8365 .8389 8413 .8438 .8461 .8485 .8508 .8531 .8554 .8577 .8599 .8621 .8643 .8665 .8686 .8708 .8729 .8749 .8770 8790 8810 .8830 .8849 .8869 .8888 .8907 .8925 .8944 .8962 .8980 .8997 .9032 .9049 .9066 .9082 .9099 9115 .9131 .9147…arrow_forwardFind the indicated area under the standard normal curve. To the right of z = 1.41 Click here to view page 1 of the standard normal table. Click here to view page 2 of the standard normal table. The area to the right of z= 1.41 under the standard normal curve is (Round to four decimal places as needed.)arrow_forward
- Find the area of the shaded region under the standard normal curve.arrow_forward3. The heights of children 2 years old are normally distributed with a mean of 32 inches and standard deviation of 1.5 inches. Find the probability of these events. a) A 2-year-old child is taller than 36 inches.P(X>36) =b) A 2-year-old child is shorter than 34 inches.P(X<34) =c) A 2-year-old child is between 30 and 33 inches tall.P(30< X < 33) =arrow_forwardFind the area of the shaded region under the standard normal curve. Click here to view the standard normal table. The area of the shaded region is (Round to four decimal places as needed.) z = 1.12arrow_forward
- Find a z-score such that 56% of the area under the standard normal curve is below that score. Z= Click the icon to view the area under the standard normal curve table. (Round to the nearest hundredth as needed.)arrow_forwardUse the standard normal table to find the z-score that corresponds to the cumulative area 0.0150. If the area is not in the table, use the entry closest to the area. If the area is halfway between two entries, use the z-score halfway between the corresponding z-scores. Click to view page 1 of the standard normal table. Click to view page 2 of the standard normal table. (Type an integer or decimal rounded to three decimal places as needed.) Enter your answer in the answer box.arrow_forwardFind the indicated area under the standard normal curve. Between z= -2.22 and z=2.22 Click here to view page 1 of the standard normal table. Click here to view page 2 of the standard normal table. DO The area between z= -2.22 and z = 2.22 under the standard normal curve is (Round to four decimal places as needed.)arrow_forward
- Find the indicated area under the standard normal curve. To the left of z = 1.51 Click here to view page 1 of the standard normal table. Click here to view page 2 of the standard normal table. The area to the left of z = 1.51 under the standard normal curve is (Round to four decimal places as needed.)arrow_forwardFind the area of the indicated region under the standard normal curve. Click here to view page 1 of the standard normal table. Click here to view page 2 of the standard normal table. -1.2 0 1.1 ..... The area between z= - 1.2 and z =1.1 under the standard normal curve is (Round to four decimal places as needed.)arrow_forwardFind the indicated area under the standard normal curve. To the right of z= -2.76 Click here to view page 1 of the standard normal table. Click here to view page 2 of the standard normal table. The area to the right of z= -2.76 under the standard normal curve is (Round to four decimal places as needed.)arrow_forward
arrow_back_ios
SEE MORE QUESTIONS
arrow_forward_ios
Recommended textbooks for you
- MATLAB: An Introduction with ApplicationsStatisticsISBN:9781119256830Author:Amos GilatPublisher:John Wiley & Sons Inc
 Probability and Statistics for Engineering and th...StatisticsISBN:9781305251809Author:Jay L. DevorePublisher:Cengage Learning
 Statistics for The Behavioral Sciences (MindTap C...StatisticsISBN:9781305504912Author:Frederick J Gravetter, Larry B. WallnauPublisher:Cengage Learning
  Elementary Statistics: Picturing the World (7th E...StatisticsISBN:9780134683416Author:Ron Larson, Betsy FarberPublisher:PEARSON
 The Basic Practice of StatisticsStatisticsISBN:9781319042578Author:David S. Moore, William I. Notz, Michael A. FlignerPublisher:W. H. Freeman
 Introduction to the Practice of StatisticsStatisticsISBN:9781319013387Author:David S. Moore, George P. McCabe, Bruce A. CraigPublisher:W. H. Freeman
MATLAB: An Introduction with Applications
Statistics
ISBN:9781119256830
Author:Amos Gilat
Publisher:John Wiley & Sons Inc
Probability and Statistics for Engineering and th...
Statistics
ISBN:9781305251809
Author:Jay L. Devore
Publisher:Cengage Learning
Statistics for The Behavioral Sciences (MindTap C...
Statistics
ISBN:9781305504912
Author:Frederick J Gravetter, Larry B. Wallnau
Publisher:Cengage Learning
Elementary Statistics: Picturing the World (7th E...
Statistics
ISBN:9780134683416
Author:Ron Larson, Betsy Farber
Publisher:PEARSON
The Basic Practice of Statistics
Statistics
ISBN:9781319042578
Author:David S. Moore, William I. Notz, Michael A. Fligner
Publisher:W. H. Freeman
Introduction to the Practice of Statistics
Statistics
ISBN:9781319013387
Author:David S. Moore, George P. McCabe, Bruce A. Craig
Publisher:W. H. Freeman