
MATLAB: An Introduction with Applications
6th Edition
ISBN: 9781119256830
Author: Amos Gilat
Publisher: John Wiley & Sons Inc
expand_more
expand_more
format_list_bulleted
Related questions
Question
45
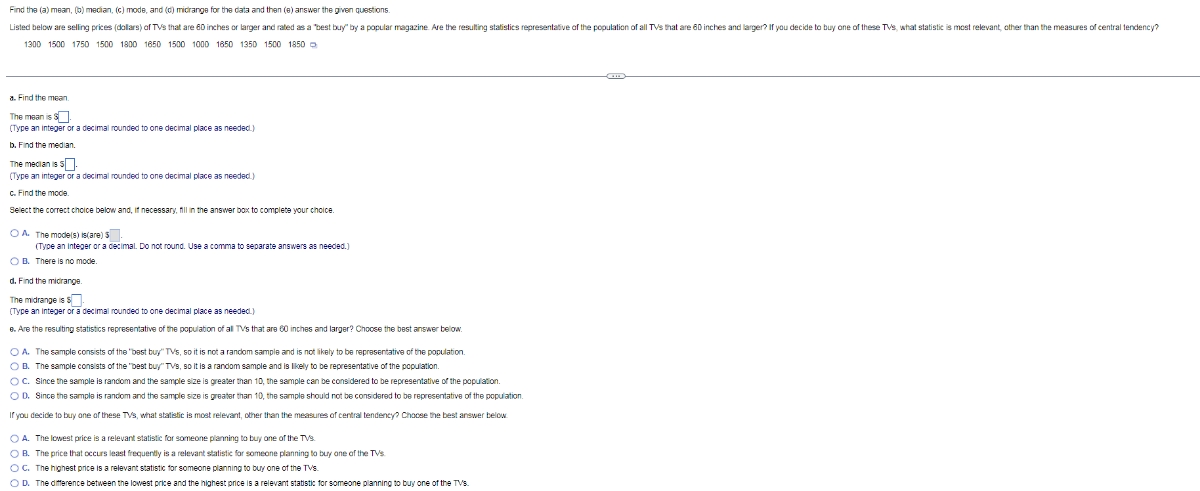

Transcribed Image Text:Find the (a) mean, (5) mecian, (C) mode, and (C) micrange for the data and then (e) answer the gven questions.
amedian.
Listed below are selling prices (dolars) of TVs that are 60 inches or larger and rated as a best buy" by a popular magazine Are the resulting statistics representative of the population of all TVs that are 60 inches and larger? If you decide to buy one of these TVs, what statistic is most relevant, other than the measures of central tendency?
1300 1500 1750 1500 1800 1850 1500 1000 1850 1350 1500 1850 -
The mean is S.
(Type an integer or a decimal rounded to one decimal place as needec.)
The mecian is 5
(Type an integer or a decimal rounded to one decimal place as needed.)
C. Find the mode.
Select the correct choice below and, if necessary, fill in the answer box to complete your choice.
O A. The mode(s) is(are) 5.
(Type an integer or a decimal. Do not round. Use a comma to separate answers as needed.)
OB. There is no mode.
d. Find the micranoe.
The midrange is S
(Type an integer or a decimal rounded to one decimal place as needec.)
6. Are the resulting statistics representative of the population of al TVs that are 60 inches and larger? Choose the best answer below.
O A. The sample consists of the 'best buy" TVs, so it is not a random sample and is not likely to be representative of the population.
O B. The sample consists of the 'best buy" TVs, so it is a random sample and is likely to be representative of the population.
OC. Since the sample is randiom and the sample size is greater than 10, the sample
be considered to be representative of the population.
O D. Since the sample is randiom and the sample size is greater than 10, the sample should not be considered to be representative of the population.
If you decide to buy ane of these TVs, what statistic is most relevant, other than the measures of central tendency? Chocse the best answer below.
O A. The lowest price is a relevant statistic
someone planning to buy ane of the TVS
OB. The price that occurs least frequently is a relevant statistic for someone planning to buy ane of the TVs
OC. The highest price is a relevant statistic for someone planning to buy one of the TVs.
O D. The difference between the lowest price and the highest price is a relevant statistic for someone planning to buy one of the TVs
Expert Solution
This question has been solved!
Explore an expertly crafted, step-by-step solution for a thorough understanding of key concepts.

This is a popular solution

Trending nowThis is a popular solution!

Step by stepSolved in 2 steps with 2 images

Knowledge Booster

Similar questions
arrow_back_ios
arrow_forward_ios
Recommended textbooks for you
- MATLAB: An Introduction with ApplicationsStatisticsISBN:9781119256830Author:Amos GilatPublisher:John Wiley & Sons Inc
 Probability and Statistics for Engineering and th...StatisticsISBN:9781305251809Author:Jay L. DevorePublisher:Cengage Learning
 Statistics for The Behavioral Sciences (MindTap C...StatisticsISBN:9781305504912Author:Frederick J Gravetter, Larry B. WallnauPublisher:Cengage Learning
  Elementary Statistics: Picturing the World (7th E...StatisticsISBN:9780134683416Author:Ron Larson, Betsy FarberPublisher:PEARSON
 The Basic Practice of StatisticsStatisticsISBN:9781319042578Author:David S. Moore, William I. Notz, Michael A. FlignerPublisher:W. H. Freeman
 Introduction to the Practice of StatisticsStatisticsISBN:9781319013387Author:David S. Moore, George P. McCabe, Bruce A. CraigPublisher:W. H. Freeman
MATLAB: An Introduction with Applications
Statistics
ISBN:9781119256830
Author:Amos Gilat
Publisher:John Wiley & Sons Inc
Probability and Statistics for Engineering and th...
Statistics
ISBN:9781305251809
Author:Jay L. Devore
Publisher:Cengage Learning
Statistics for The Behavioral Sciences (MindTap C...
Statistics
ISBN:9781305504912
Author:Frederick J Gravetter, Larry B. Wallnau
Publisher:Cengage Learning
Elementary Statistics: Picturing the World (7th E...
Statistics
ISBN:9780134683416
Author:Ron Larson, Betsy Farber
Publisher:PEARSON
The Basic Practice of Statistics
Statistics
ISBN:9781319042578
Author:David S. Moore, William I. Notz, Michael A. Fligner
Publisher:W. H. Freeman
Introduction to the Practice of Statistics
Statistics
ISBN:9781319013387
Author:David S. Moore, George P. McCabe, Bruce A. Craig
Publisher:W. H. Freeman