
MATLAB: An Introduction with Applications
6th Edition
ISBN: 9781119256830
Author: Amos Gilat
Publisher: John Wiley & Sons Inc
expand_more
expand_more
format_list_bulleted
Related questions
Question
thumb_up100%
3-Help with all the parts of this exercise please. Thanks in advance.
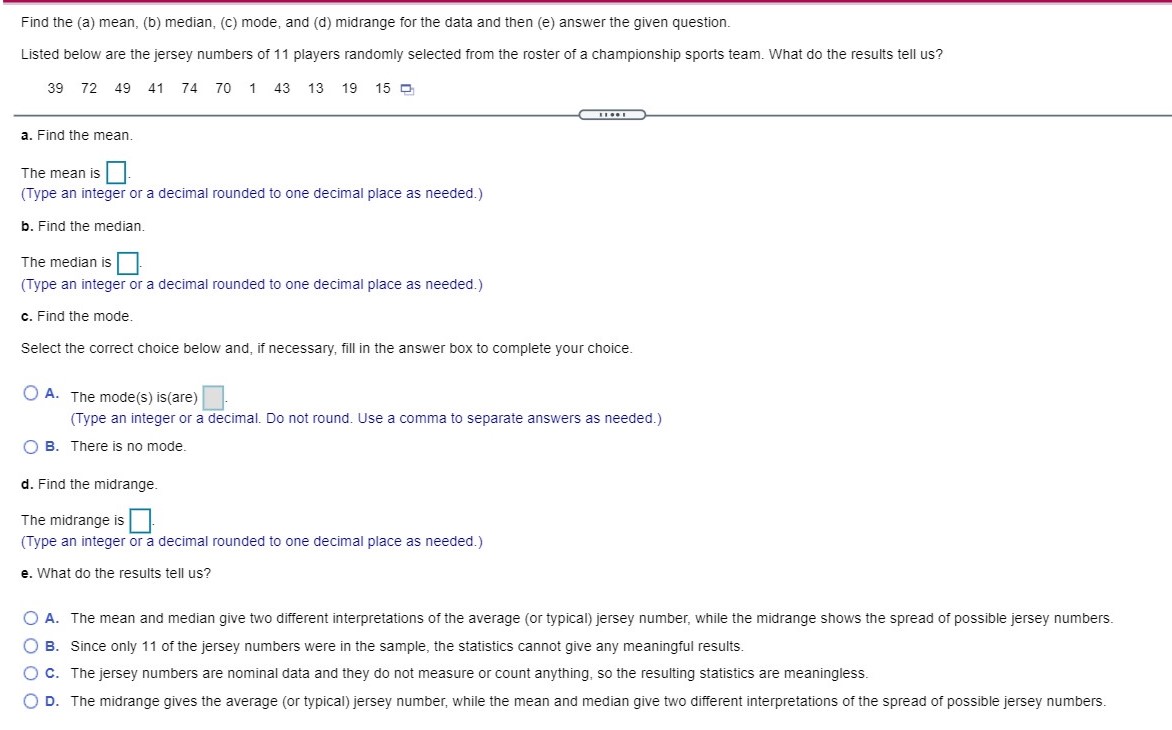

Transcribed Image Text:**Title: Analyzing Jersey Numbers in Sports Teams**
**Find the Mean, Median, Mode, and Midrange**
Listed below are the jersey numbers of 11 players randomly selected from the roster of a championship sports team. What do the results tell us?
**Jersey Numbers:**
39, 72, 49, 41, 74, 70, 1, 43, 13, 19, 15
### a. Find the Mean
- **The mean** is calculated by adding all the numbers together and dividing by the number of data points.
### b. Find the Median
- **The median** is the middle number in a sorted, ascending or descending, list of numbers.
### c. Find the Mode
- **The mode** is the number that appears most frequently in a data set.
**Options:**
- **A.** The mode(s) is(are) ____ (fill in if present).
- **B.** There is no mode.
### d. Find the Midrange
- **The midrange** is found by adding the maximum and minimum values and dividing by two.
### e. What do the results tell us?
Choose the option that best represents the statistical conclusion:
- **A.** The mean and median provide different insights into the typical jersey number, while the midrange shows the spread.
- **B.** Since there are only 11 jerseys sampled, the statistics may not be conclusive.
- **C.** Jersey numbers are nominal data; hence, these statistics might lack significance.
- **D.** The midrange indicates the typical number, while the mean and median offer varying views on the spread.
This exercise illustrates how statistical measures can help interpret data, providing insights into team dynamics or other practical applications.
Expert Solution
arrow_forward
Step 1
We have given data
39,72,49,41,74,70,1,43,13,19,15
Mean = sum of all observations / total number of observations
Median = middle value
Mode = most frequent value
Note:-According to Bartleby Expert guideline, we can answer only first three subparts of a question and rest can be reposted

Trending nowThis is a popular solution!

Step by stepSolved in 2 steps with 1 images

Knowledge Booster

Similar questions
- Can you help me with thisarrow_forwardhelp mearrow_forwardfind the cost of a fish sandwich. - A food service in the mall prepares free samples of chicken to give out during dinner time. One hour later, the food service has given out 4 fewer than 70% of the total number of samples. How many samples did the food service prepare if they gave out 80 samples in the first hour? Big Ideas Math: Modeling Real Life Grade 8 Student Journal Copyright©arrow_forward
- How would I solve this question?arrow_forwardWrite a complete solution including all necessary calculations, formulas, and a listing of all variables and their values Find the % of a two year commuter budget which is spent on room and board.arrow_forwardI am struggling with this question, please help me with step by step answer, really appreciate itarrow_forward
- Help me fast with detail explanation. Definitely I will give Upvote.arrow_forwardPlease help me answer the following questions. Thank youarrow_forwardHi, could you please solve the questions using R? For the data, please use the data I attached in the screenshot. (I tried to upload the data, but the program would not let me) So, solve the questions based on the data I uploaded. Thank youarrow_forward
arrow_back_ios
SEE MORE QUESTIONS
arrow_forward_ios
Recommended textbooks for you
- MATLAB: An Introduction with ApplicationsStatisticsISBN:9781119256830Author:Amos GilatPublisher:John Wiley & Sons Inc
 Probability and Statistics for Engineering and th...StatisticsISBN:9781305251809Author:Jay L. DevorePublisher:Cengage Learning
 Statistics for The Behavioral Sciences (MindTap C...StatisticsISBN:9781305504912Author:Frederick J Gravetter, Larry B. WallnauPublisher:Cengage Learning
  Elementary Statistics: Picturing the World (7th E...StatisticsISBN:9780134683416Author:Ron Larson, Betsy FarberPublisher:PEARSON
 The Basic Practice of StatisticsStatisticsISBN:9781319042578Author:David S. Moore, William I. Notz, Michael A. FlignerPublisher:W. H. Freeman
 Introduction to the Practice of StatisticsStatisticsISBN:9781319013387Author:David S. Moore, George P. McCabe, Bruce A. CraigPublisher:W. H. Freeman
MATLAB: An Introduction with Applications
Statistics
ISBN:9781119256830
Author:Amos Gilat
Publisher:John Wiley & Sons Inc
Probability and Statistics for Engineering and th...
Statistics
ISBN:9781305251809
Author:Jay L. Devore
Publisher:Cengage Learning
Statistics for The Behavioral Sciences (MindTap C...
Statistics
ISBN:9781305504912
Author:Frederick J Gravetter, Larry B. Wallnau
Publisher:Cengage Learning
Elementary Statistics: Picturing the World (7th E...
Statistics
ISBN:9780134683416
Author:Ron Larson, Betsy Farber
Publisher:PEARSON
The Basic Practice of Statistics
Statistics
ISBN:9781319042578
Author:David S. Moore, William I. Notz, Michael A. Fligner
Publisher:W. H. Freeman
Introduction to the Practice of Statistics
Statistics
ISBN:9781319013387
Author:David S. Moore, George P. McCabe, Bruce A. Craig
Publisher:W. H. Freeman