
Advanced Engineering Mathematics
10th Edition
ISBN: 9780470458365
Author: Erwin Kreyszig
Publisher: Wiley, John & Sons, Incorporated
expand_more
expand_more
format_list_bulleted
Related questions
Concept explainers
Question
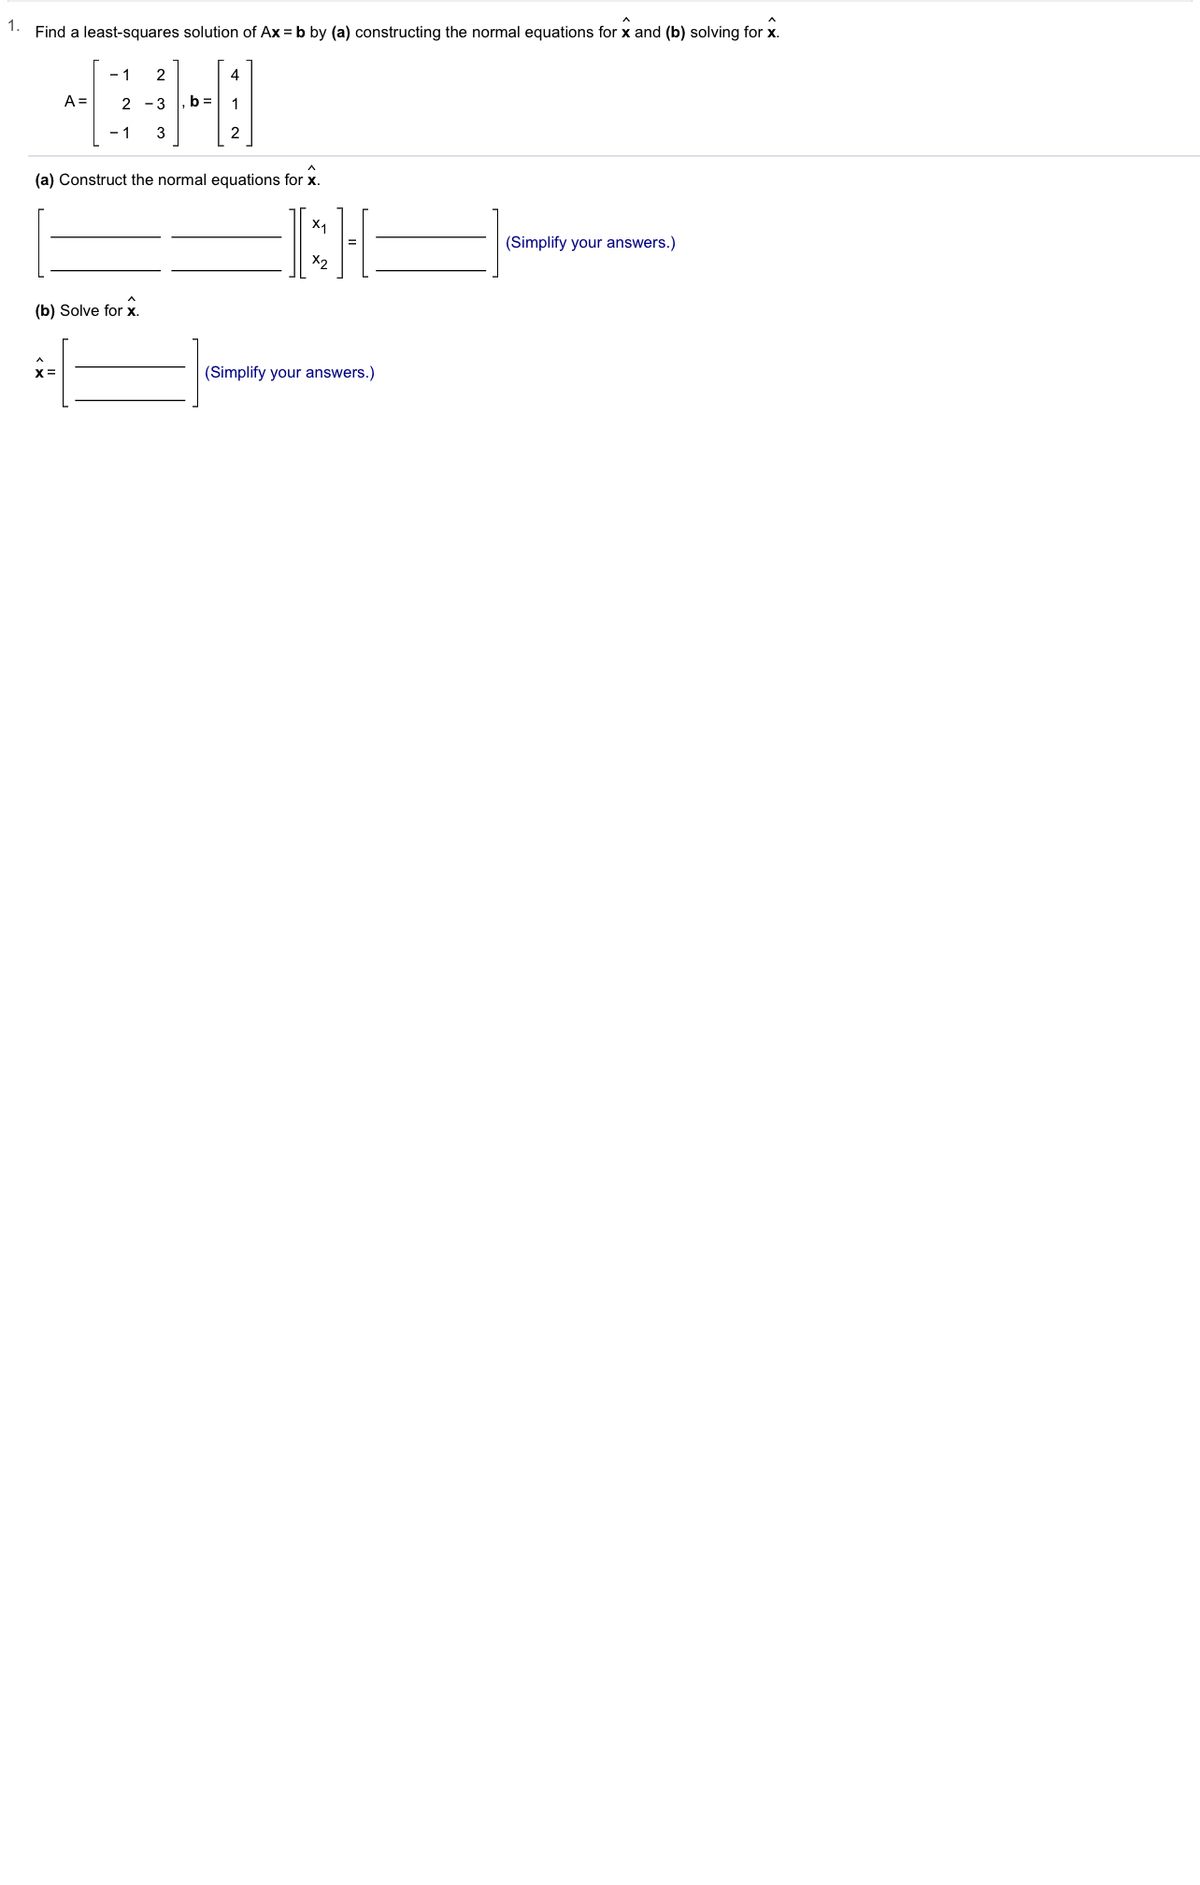

Transcribed Image Text:1.
Find a least-squares solution of Ax = b by (a) constructing the normal equations for x and (b) solving for x.
- 1
2
4
A =
2 -3
b =
1
- 1
3
2
(a) Construct the normal equations for x.
(Simplify your answers.)
(b) Solve for x.
(Simplify your answers.)
Expert Solution
This question has been solved!
Explore an expertly crafted, step-by-step solution for a thorough understanding of key concepts.

Step by stepSolved in 3 steps with 3 images

Knowledge Booster


Learn more about
Need a deep-dive on the concept behind this application? Look no further. Learn more about this topic, advanced-math and related others by exploring similar questions and additional content below.Similar questions
- According to the data reported by the New York State Department of Health regarding West Nile Virus for the years 2000-2008, the least squares line equation for the number of reported dead birds (x) versus the number of human West Nile virus cases (y) is y=−10.2638+0.0491x. If the number of dead birds reported in a year is 732, how many human cases of West Nile virus can be expected? Also we know r=0.5490. No prediction can be made. 19.6 26 38.1arrow_forwardWhat is the least squares prediction equation? y=enter your response here+enter your response here x1+enter your response here x2 (Type integers or decimals.)arrow_forwardFind the coefficients of the least-squares line of "best fit", y = ax + b, for the data, (1, 2), (3, 3), (4, 1), (4,3), (6,5).arrow_forward
- True or False: The Regression Sum of Squares (SSR) can never be greater than the Error Sum of Squares (SSE).arrow_forwardThe scatter plot below shows data for the average cost of a high-end computer (y, in dollars) in the year x years since 2000. The least squares regression line is given by yˆ=−1677+314x. A coordinate plane has a horizontal x-axis labeled Year from 4 to 12 in increments of 2 and a vertical y-axis labeled Cost in dollars from 0 to 2000 in increments of 500. The following points are plotted: left-parenthesis 6 comma 250 right-parenthesis, left-parenthesis 7 comma 550 right-parenthesis, left-parenthesis 9 comma 1000 right-parenthesis, left-parenthesis 10 comma 1300 right-parenthesis, and left-parenthesis 11 comma 2000 right-parenthesis. A line rises from left to right, passing through left-parenthesis 7 comma 550 right-parenthesis and left-parenthesis 10 comma 1500 right-parenthesis. All coordinate are approximate. Interpret the y-intercept of the least squares regression line. Select the correct answer below: The predicted cost of a computer in the year 0 is…arrow_forwardFind the equation y = Bo + B₁x of the least-squares line that best fits the given data points. (1,3), (2,3), (3,4), (4,4) The line is y = 2.49 + 0.44 x. (Type integers or decimals.)arrow_forward
- The scatter plot below shows data for the average cost of a high-end computer (y, in dollars) in the year x years since 2000. The least squares regression line is given by yˆ=−1677+314x. A coordinate plane has a horizontal x-axis labeled Year from 4 to 12 in increments of 2 and a vertical y-axis labeled Cost in dollars from 0 to 2000 in increments of 500. The following points are plotted: left-parenthesis 6 comma 250 right-parenthesis, left-parenthesis 7 comma 550 right-parenthesis, left-parenthesis 9 comma 1000 right-parenthesis, left-parenthesis 10 comma 1300 right-parenthesis, and left-parenthesis 11 comma 2000 right-parenthesis. A line rises from left to right, passing through left-parenthesis 7 comma 550 right-parenthesis and left-parenthesis 10 comma 1500 right-parenthesis. All coordinate are approximate. Interpret the slope of the least squares regression line. Select the correct answer below: On average, the average cost of a high-end computer is…arrow_forwardA least squares regression line was calculated to relate the length (cm) of newbom boys to their weight in kg. The regression analysis gives the model Weight = -5.11 +0.1952 Length. Complete parts a through c below. O D. For every additional 1 kg of weight, the length of the baby is predicted to increase by 0.1952 mm. b) If a baby is 53 cm long, what is his predicted weight? O kg (Round to two decimal places as needed.) c) Consider a baby boy that was 48 cm long and weighed 3 kg. According to the regression model, what was his residual? What does that say about him? The residual is . (Round to two decimal places as needed.) This means that the baby is kg V than predicted by his length. (Round to two decimal places as needed.)arrow_forwardConsider the following. (-8, 0) y = -5 y 6 4 (0, 2) (a) Find the least squares regression line. 5 (8,6) (b) Calculate S, the sum of the squared errors. Use the regression capabilities of a graphing utility to verify your results.arrow_forward
- Biologist Theodore Garland, Jr. studied the relationship between running speeds and morphology of 49 species of cursorial mammals (mammals adapted to or specialized for running). One of the relationships he investigated was maximal sprint speed in kilometers per hour and the ratio of metatarsal-to-femur length. A least-squares regression on the data he collected produces the equation ŷ = 37.67 + 33.18x where x is metatarsal-to-femur ratio and y is predicted maximal sprint speed in kilometers per hour. The standard error of the intercept is 5.69 and the standard error of the slope is 7.94. Construct a 96% confidence interval for the slope of the population regression line. Give your answers precise to at least two decimal places. contact us help 6:42 PM povecy polcy terms of use careers A E O 4») 18 -క90.4 58 12/14/2020 a 17 |耳 即 delets prt sc insert 112 19 18 + 16 backspace f5 fAarrow_forwardFind the least squares regression line for the points {(-2, –5), (2, –1), (3, 2), (4, 7)}.arrow_forwardtwo variables have at least squares regression line of 28.77 + 0.346 7x. Calculate the value of y that is predicted for an x value of 35.arrow_forward
arrow_back_ios
SEE MORE QUESTIONS
arrow_forward_ios
Recommended textbooks for you
- Advanced Engineering MathematicsAdvanced MathISBN:9780470458365Author:Erwin KreyszigPublisher:Wiley, John & Sons, Incorporated
 Numerical Methods for EngineersAdvanced MathISBN:9780073397924Author:Steven C. Chapra Dr., Raymond P. CanalePublisher:McGraw-Hill Education
 Introductory Mathematics for Engineering Applicat...Advanced MathISBN:9781118141809Author:Nathan KlingbeilPublisher:WILEY
  Mathematics For Machine TechnologyAdvanced MathISBN:9781337798310Author:Peterson, John.Publisher:Cengage Learning,

Advanced Engineering Mathematics
Advanced Math
ISBN:9780470458365
Author:Erwin Kreyszig
Publisher:Wiley, John & Sons, Incorporated
Numerical Methods for Engineers
Advanced Math
ISBN:9780073397924
Author:Steven C. Chapra Dr., Raymond P. Canale
Publisher:McGraw-Hill Education
Introductory Mathematics for Engineering Applicat...
Advanced Math
ISBN:9781118141809
Author:Nathan Klingbeil
Publisher:WILEY
Mathematics For Machine Technology
Advanced Math
ISBN:9781337798310
Author:Peterson, John.
Publisher:Cengage Learning,