
MATLAB: An Introduction with Applications
6th Edition
ISBN: 9781119256830
Author: Amos Gilat
Publisher: John Wiley & Sons Inc
expand_more
expand_more
format_list_bulleted
Related questions
Question
Fin the indicated area under the standard normal curve.
Between z= 0 and z= 0.71
The area between z=0 and z=0.71 under the standar normal curve is =
(Round to four decimal places as needed).
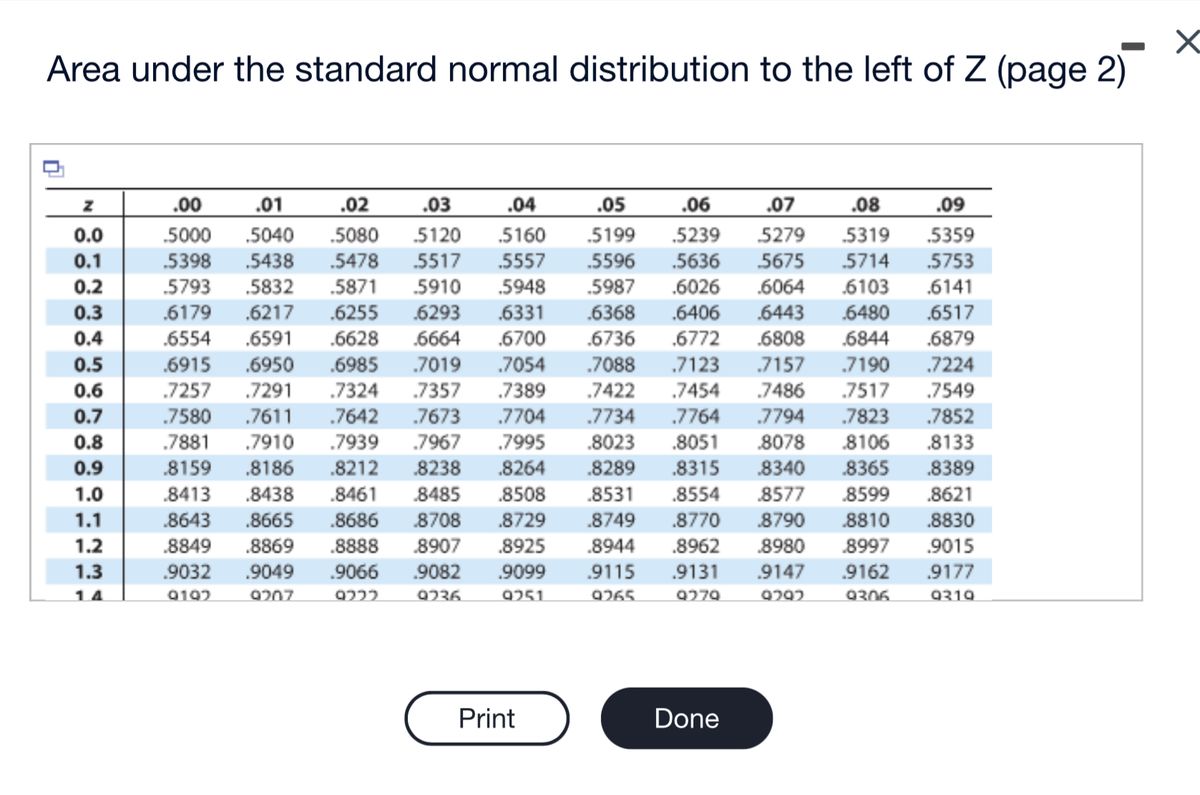

Transcribed Image Text:Area under the standard normal distribution to the left of Z (page 2)
Z
0.0
0.1
0.2
0.3
0.4
0.5
0.6
0.7
0.8
0.9
1.0
1.1
1.2
1.3
14
.08
.06 .07
.5239 5279 5319
5675 5714
.02
.09
.5359
.00 .01
.03 .04
.05
.5000 .5040 .5080 5120 .5160 .5199
.5398 .5438 .5478 .5517 .5557
.5871 5910 .5948
.6255 .6293 .6331
.5596 .5636
.5753
.5793 .5832
.5987 .6026 .6064
.6103 .6141
.6179 .6217
.6368 .6406
.6443
.6480
.6517
.6554 .6591
.6628
.6664
.6700
.6736
.6772
.6808
.6844
.6879
.6915 .6950
.6985
.7019
.7054
.7088
.7123 .7157
.7190
.7224
.7324 .7357 .7389
.7422
.7454 .7486 .7517
.7549
.7257 .7291
.7580 .7611 .7642 .7673 .7704 .7734 .7764
.7794 .7823
.7852
.7881
.8023
.8106
.8133
.7910 .7939 .7967 .7995
.8186 .8212 .8238 .8264
.8413 .8438 .8461
.8159
.8289 .8315
.8340 .8365
.8389
.8577 .8599
.8621
.8643
8790
8810
.8830
.8485 .8508 .8531 .8554
.8665 .8686 .8708 .8729 .8749 .8770
.8944 .8962
.9115 .9131 .9147 .9162
.8849
.8980 .8997
.9015
.8869 .8888 .8907 .8925
.9049 .9066 .9082 .9099
.9032
.9177
9192
9207
9222
9236
9251
9265
9279
9292
9306
9319
Print
.8051 .8078
Done
X

Transcribed Image Text:-
Area under the standard normal distribution to the left of Z (page 2)
1.4
1.5
1.6
1.7
1.8
1.9
2.0
2.1
2.2
2.3
2.4
2.5
2.6
2.7
2.8
2.9
3.0
3.1
.9319
.9441
.9545
.9633
.9699
9706
.9192 .9207 .9222 .9236 .9251 .9265 .9279 .9292 .9306
.9332 .9345 .9357 .9370 .9382 .9394 .9406 .9418 .9429
.9452 .9463 .9474 .9484 .9495 .9505 .9515 .9525 .9535
.9554 .9564 .9573 .9582 .9591 .9599 .9608 .9616 .9625
.9641 .9649 .9656 .9664 .9671 .9678 .9686
.9713 .9719 .9726 .9732 .9738 .9744
.9772 .9778 .9783 .9788
.9821 .9826 .9830 .9834 .9838
.9861 .9864 .9868 .9871 .9875
.9893 .9896 .9898 .9901 .9904
.9925
.9693
.9750 .9756 .9761
.9767
.9793 .9798
.9808 .9812
.9817
.9803
.9842 .9846
.9878 .9881 .9884
.9850
.9854
.9857
.9887
.9890
.9906
.9909
.9911 .9913 .9916
.9927
.9929
.9931
.9932 .9934
.9936
.9918 .9920 .9922
.9941
.9938 .9940
.9943
.9945
.9946 .9948
.9949 .9951
.9952
.9953 .9955 .9956
.9957
.9959
.9960
.9961
.9962 .9963
.9964
.9968 .9969
.9970
.9971 .9972 .9973
.9974
.9978
.9979 .9980
.9981
.9965 .9966 .9967
.9974 .9975 9976 .9977 .9977
.9983 .9984
.9988 .9988
.9979
.9984 .9985
.9981 .9982
.9982
.9985 .9986
.9986
.9987
.9987
.9987
.9989 .9989 .9990
.9990
.9989
9992
9990
9991
9991
9991
9992
9992
9992
9993
9993
Print
Done
X
Expert Solution
This question has been solved!
Explore an expertly crafted, step-by-step solution for a thorough understanding of key concepts.

Step by stepSolved in 2 steps with 3 images

Knowledge Booster

Similar questions
- Find the indicated area under the standard normal curve. Between z= 0 and z 2.08 Click here to view page 1 of the standard normal table. Click here to view page 2 of the standard normal table. The area between z= 0 and z 2.08 under the standard normal curve is (Round to four decimal places as needed.)arrow_forwardFind the area under the standard normal curve to the right of z= 1. Round to four decimal places. OA. 0.1587 OB. 0.5398 OC. 0.1397 OD. 0.8413 10 Question Viewer DELLarrow_forwardFind the area under the standard normal curve that lies between z=-2. 8and z=1.2 Answer:0.8824 Explain how to get this answer on a TI-84 Plus Calc.arrow_forward
- have a lot of troublearrow_forwardFind the indicated area under the standard normal curve. To the left of z = -2.92 and to the right of z = 2.92 Dick here to view page 1 of the standard normal table Click here to view page 2 of the standard normal tablearrow_forwardFind the area of the indicated region under the standard normal curve. Click here to view page 1 of the standard normal table. Click here to view page 2 of the standard normal table. The area between z = - 1.1 and z = 1.4 under the standard normal curve is (Round to four decimal places as needed.)arrow_forward
- Determine the area under the standard normal curve that lies to the left of (a) Z= -0.28, (b) Z = -0.93, (c) Z= -0.73, and (d) Z= -0.43. Click the icon to view a table of areas under the normal curve. (a) The area to the left of Z= -0.28 is ound to four decimal places as needed.) 1- O E 'G 9 DELL 20arrow_forwardFind the indicated area under the standard normal curve. Between z= - 1.37 and z = 1.37 Click here to view page 1 of the standard normal table. Click here to view page 2 of the standard normal table, The area between z= - 1.37 and z =1.37 under the standard normal curve is (Round to four decimal places as needed.)arrow_forwardFind the indicated area under the standard normal curve. Between z= - 2.56 and z = 2.56 Click here to view page 1 of the standard normal table. Click here to view page 2 of the standard normal table. ..... The area between z= - 2.56 and z = 2.56 under the standard normal curve is (Round to four decimal places as needed.)arrow_forward
- Sketch the area under the standard normal curve over the indicated interval and find the specified area. (Round your answer to four decimal places.) The area between z = 1.40 and z = 2.16 is .arrow_forwardSketch the area under the standard normal curve over the indicated interval and find the specified area. (Enter a number. Round your answer to four decimal places.) The area between z = 0.34 and z = 1.92 is .arrow_forward
arrow_back_ios
arrow_forward_ios
Recommended textbooks for you
- MATLAB: An Introduction with ApplicationsStatisticsISBN:9781119256830Author:Amos GilatPublisher:John Wiley & Sons Inc
 Probability and Statistics for Engineering and th...StatisticsISBN:9781305251809Author:Jay L. DevorePublisher:Cengage Learning
 Statistics for The Behavioral Sciences (MindTap C...StatisticsISBN:9781305504912Author:Frederick J Gravetter, Larry B. WallnauPublisher:Cengage Learning
  Elementary Statistics: Picturing the World (7th E...StatisticsISBN:9780134683416Author:Ron Larson, Betsy FarberPublisher:PEARSON
 The Basic Practice of StatisticsStatisticsISBN:9781319042578Author:David S. Moore, William I. Notz, Michael A. FlignerPublisher:W. H. Freeman
 Introduction to the Practice of StatisticsStatisticsISBN:9781319013387Author:David S. Moore, George P. McCabe, Bruce A. CraigPublisher:W. H. Freeman
MATLAB: An Introduction with Applications
Statistics
ISBN:9781119256830
Author:Amos Gilat
Publisher:John Wiley & Sons Inc
Probability and Statistics for Engineering and th...
Statistics
ISBN:9781305251809
Author:Jay L. Devore
Publisher:Cengage Learning
Statistics for The Behavioral Sciences (MindTap C...
Statistics
ISBN:9781305504912
Author:Frederick J Gravetter, Larry B. Wallnau
Publisher:Cengage Learning
Elementary Statistics: Picturing the World (7th E...
Statistics
ISBN:9780134683416
Author:Ron Larson, Betsy Farber
Publisher:PEARSON
The Basic Practice of Statistics
Statistics
ISBN:9781319042578
Author:David S. Moore, William I. Notz, Michael A. Fligner
Publisher:W. H. Freeman
Introduction to the Practice of Statistics
Statistics
ISBN:9781319013387
Author:David S. Moore, George P. McCabe, Bruce A. Craig
Publisher:W. H. Freeman