Question

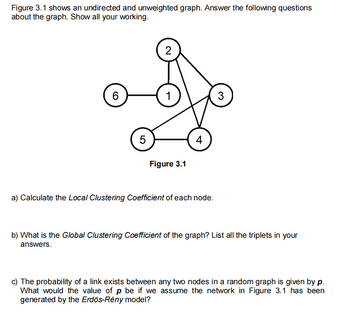
Transcribed Image Text:Figure 3.1 shows an undirected and unweighted graph. Answer the following questions
about the graph. Show all your working.
6
5
2
1
Figure 3.1
4
a) Calculate the Local Clustering Coefficient of each node.
3
b) What is the Global Clustering Coefficient of the graph? List all the triplets in your
answers.
c) The probability of a link exists between any two nodes in a random graph is given by p.
What would the value of p be if we assume the network in Figure 3.1 has been
generated by the Erdös-Rény model?
Expert Solution
This question has been solved!
Explore an expertly crafted, step-by-step solution for a thorough understanding of key concepts.
Step by stepSolved in 5 steps with 2 images

Knowledge Booster
Similar questions
- This has 7 points on the graph, Can i see one with 10 like said in the original question?arrow_forward5. Prim's: What would be the output of Prim's for the following graph (starting at a). Select a valid MST. 7 2 3 6.arrow_forwardConsider the following graph: a Specify a simple cycle. Use only lower case letters. If the graph has any cycles which are not simple and which have no repeated edges, specify one. If there are none enter none Use only lower case letters.arrow_forward
- If we have two different non crossing drawings of the same connected graph, is it possible for the two drawings to have a different number of faces?arrow_forwardA circuit is simple if the graph has no repeated edges. Draw a connected, undirected graph with seven vertices and no simple circuit. How many edges does it have?arrow_forward• If a planar graph has 11 vertices and four times as many edges as faces, how many faces does it have? Is there a planar graph with 13 vertices that has three times more edges than faces?arrow_forward
- Can you give a picture or draw the actual connected graph?arrow_forward2. Answer the following questions about the graph given below. B E a) Does an Euler circuit exist? Why or why not? b) Find a good eulerization for the graph, using as few duplicated edges as possible. How many edges must be added? c) Use the eulerization you developed in part b) to determine a best circuit for this graph, beginning at vertex A. List this path by listing successive vertices. 1 3. Consider the complete graph given below. 24 14 46 B, 32 51 28 a) Find the length of the sorted-edges tour for this graph. Use wiggly lines to indicate this tour. b) Find the length of the nearest-neighbor tour starting at vertex A. Use wiggly lines to indicate this tour.arrow_forward
arrow_back_ios
arrow_forward_ios