MATLAB: An Introduction with Applications
6th Edition
ISBN: 9781119256830
Author: Amos Gilat
Publisher: John Wiley & Sons Inc
expand_more
expand_more
format_list_bulleted
Question

Transcribed Image Text:Females
SPAR
Males
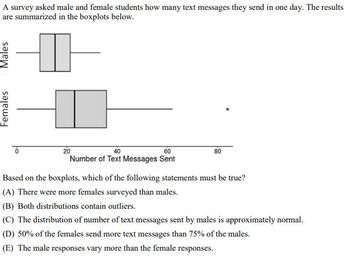
A survey asked male and female students how many text messages they send in one day. The results
are summarized in the boxplots below.
40
60
80
Number of Text Messages Sent
Based on the boxplots, which of the following statements must be true?
(A) There were more females surveyed than males.
(B) Both distributions contain outliers.
(C) The distribution of number of text messages sent by males is approximately normal.
(D) 50% of the females send more text messages than 75% of the males.
(E) The male responses vary more than the female responses.
Expert Solution
This question has been solved!
Explore an expertly crafted, step-by-step solution for a thorough understanding of key concepts.
Step by stepSolved in 2 steps

Knowledge Booster
Similar questions
- q17B-arrow_forward97 71 80 29 71 55 44 d. What is the mean (T) of this data set? e. What is the median of this data set? f. What is the mode of this data set? 76 68 56arrow_forwardThe following table represents the survey conducted in a school. Male female Chicken fried steak 26 16 Chicken nugget 17 25 What percent of students like to have chicken nugget?arrow_forward
- The table shows, for four cruises, the numbers of crew members, passengers, and entertainers (not included as passengers). Find (a) the mean and (b) the median total number of persons per cruise. Cruise Cruise 1 Cruise 2 Cruise 3 Cruise 4 Crew Passengers 1600 3400 1300 2500 183 225 177 213 Entertainers 40 75 10 55arrow_forwardThe tuition and fees (in thousands of dollars) for the top 14 universities in a recent year are listed below. Find the mean, median, and mode of the data, if possible. If any of these measures cannot be found or a measure does not represent the center of the data, explain why. 39 43 43 47 43 35 41 41 47 47 46 43 43 41 Find the mode of the costs. Select the correct choice below and, if necessary, fill in the answer box to complete your choice. OA. The mode(s) of the costs is (are). (Round to one decimal place as needed. Use a comma to separate answers as needed.) B. There is no mode. Does (Do) the mode(s) represent the center of the data? A. The mode(s) represent(s) the center. B. The mode(s) does (do) not represent the center because it (they) is (are) not a data value. C. There is no mode. D. The mode(s) does (do) not represent the center because it (one) is the smallest data value. O E. The mode(s) does (do) not represent the center because it (one) is the largest data value.arrow_forwardBetter Business Bureau Complaints. In 2016 the Better Business Bureau settled 80% of complaints they received in the United States. Suppose you have been hired by the Better Business Bureau to investigate the complaints they received this year involving new car dealers. You plan to select a sample of new car dealer complaints to estimate the proportion of complaints the Better Business Bureau is able to settle. Assume the population proportion of complaints settled for new car dealers is .80, the same as the overall proportion of complaints settled in 2016.arrow_forward
- A pie chart reflects student performance... 16% As, 24% Bs, 32% Cs, 16% Ds, 12% Fs A. There were 317 students in total. How many students received As? B. If a student is selected at random what's the percentage it be a C student?arrow_forwardFifteen students are asked to pick a number between 1 and 22. The numbers were recorded and organized into the following stemplot. Stem Leaf 0 2 3 3 5 6 7 7 8 1 0 1 1 2 3 5 2 1 (a)Determine the 5-features of data. (b)Are there any outliers? Explain your reasoning. (c)If you guessed 14, what percentile are you in? What percent of students guessed larger numbers?arrow_forwardSolve the last question pleasearrow_forward
- Claim: Fewer than 91% of adults have a cell phone. In a reputable poll of 1119 adults, 83% said that they have a cell phone. Find the value of the test statistic.arrow_forwardIs the boxplot skewed and does it have any outliers?arrow_forwardStaddlad 1. Find the mean, median, and mode of the following data: 26, 52, 37, 22, 24, 45, 58, 28, 39, 60, 25, 47, 23, 56, 28arrow_forward
arrow_back_ios
SEE MORE QUESTIONS
arrow_forward_ios
Recommended textbooks for you
 MATLAB: An Introduction with ApplicationsStatisticsISBN:9781119256830Author:Amos GilatPublisher:John Wiley & Sons Inc
 Probability and Statistics for Engineering and th...StatisticsISBN:9781305251809Author:Jay L. DevorePublisher:Cengage Learning
 Statistics for The Behavioral Sciences (MindTap C...StatisticsISBN:9781305504912Author:Frederick J Gravetter, Larry B. WallnauPublisher:Cengage Learning
 Elementary Statistics: Picturing the World (7th E...StatisticsISBN:9780134683416Author:Ron Larson, Betsy FarberPublisher:PEARSON
 The Basic Practice of StatisticsStatisticsISBN:9781319042578Author:David S. Moore, William I. Notz, Michael A. FlignerPublisher:W. H. Freeman
 Introduction to the Practice of StatisticsStatisticsISBN:9781319013387Author:David S. Moore, George P. McCabe, Bruce A. CraigPublisher:W. H. Freeman

MATLAB: An Introduction with Applications
Statistics
ISBN:9781119256830
Author:Amos Gilat
Publisher:John Wiley & Sons Inc

Probability and Statistics for Engineering and th...
Statistics
ISBN:9781305251809
Author:Jay L. Devore
Publisher:Cengage Learning

Statistics for The Behavioral Sciences (MindTap C...
Statistics
ISBN:9781305504912
Author:Frederick J Gravetter, Larry B. Wallnau
Publisher:Cengage Learning

Elementary Statistics: Picturing the World (7th E...
Statistics
ISBN:9780134683416
Author:Ron Larson, Betsy Farber
Publisher:PEARSON

The Basic Practice of Statistics
Statistics
ISBN:9781319042578
Author:David S. Moore, William I. Notz, Michael A. Fligner
Publisher:W. H. Freeman

Introduction to the Practice of Statistics
Statistics
ISBN:9781319013387
Author:David S. Moore, George P. McCabe, Bruce A. Craig
Publisher:W. H. Freeman