
Related questions
Concept explainers
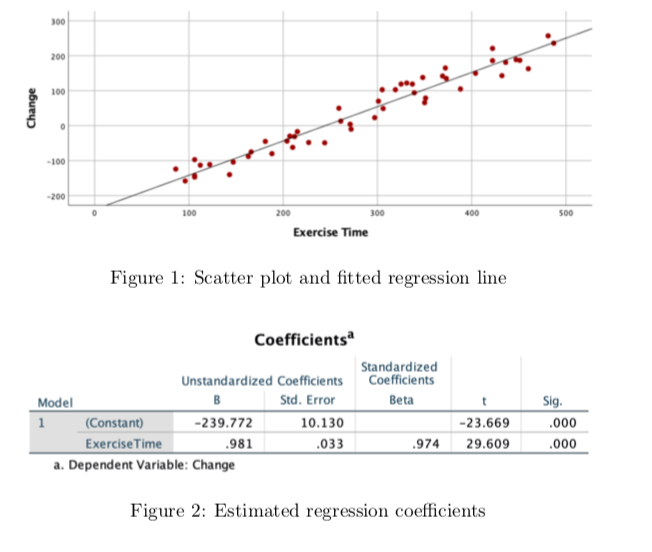
This is a continuation of the last question I posted:
f. The value of linear
i. 0.948
ii. 0.974
iii. -0.948
iv. -0.974
g.Based on your answer in part (f), the linear dependance between weekly exercise time and change in cholesterol level is strong negative
i. True
ii. False
H. When weekly exercise time is 460 minutes (approximately 66 minutes per day), the 95 percent confidence interval for change in cholesterol level is (197.3, 225.4). This means that:
i. If one person exercises 460 minutes per week, his/hers change in cholesterol level will be between 197.3 and 225.4 with 95 percent certainty.
ii. If several people exercise 460 minutes per week, their average change in choles- terol level will be between 197.3 and 225.4 with 95 percent certainty.
I. When weekly exercise time is 460 minutes (approximately 66 minutes per day), the 95 percent prediction interval for change in cholesterol level is (155.1, 267.6). This means that
i. If one person exercises 460 minutes per week, his/hers change in cholesterol level will be between 155.1 and 267.6 with 95 percent certainty.
ii. If several people exercise 460 minutes per week, their average change in choles- terol level will be between 155.1 and 267.6 with 95 percent certainty.


Step by stepSolved in 5 steps with 1 images


- The data below was collected from manufacturer advertisements of their vehicles horsepower (x) and highway gas mileage (mpg=y). Use this data to answer the following questions. horsepower 146 250 340 350 390 190 220 mpg 33 28 15 17 11 35 42 1. Find the p-value to determine if there is a linear correlation between horsepower and highway gas mileage (mpg). Record the p-value below. Round to four decimal places.p-value==2. Is there a linear correlation between horsepower and highway gas mileage (mpg)? 3. If there is a linear correlation, write the correlation coefficient below. Otherwise, leave it blank. Round your final answer to four decimal places. Be careful with your sign.r=r= 4. If there is a linear correlation, write the regression equation below. Otherwise, leave it blank. Round all numbers to four decimal places.ˆy=y^=5. Using the data shown above, predict the the highway gas mileage (mpg) for a car that has a horsepower of 225. Round your final answer to two decimal…arrow_forwardWhich of the following is true of the correlation r? It measures the strength of the straight-line relationship between two quantitative variables. It cannot be greater than 1 or less than 1. A correlation of +1 or –1 can only happen if there is a perfect straight-line relationship between two quantitative variables. Correlation is 0 only when there is no association between the variables. Correlation changes when the explanatory and response variables are switched.arrow_forwardThe following statement contains an error. Choose the statement that best explains the error. "The correlation between shoe size and height is 0.87 inches" A. Correlation requires that both of the variables be categorical B. When stating the correlation coefficient, one must state whether it is a positive or negative relationship C. This statement does not tell us whether or not shoe size is correlated with height D. When reporting correlation, one does not report units because correlation has no units E. There is no error in this statementarrow_forward
- The authors of a paper presented a correlation analysis to investigate the relationship between maximal lactate level x and muscular endurance y. The accompanying data was read from a plot in the paper. X 390 740 760 y 3.90 r 3.90 5.00 5.30 4.10 3.60 6.20 OH₂: P = 0 Ha: P 0 1,465 1,470 1,495 2,190 t = P-value = 6.98 7.45 4.85 7.70 4.55 6.70 8.80 OH₂: P = 0 H₂: P = 0 Compute the value of the sample correlation coefficient, r. (Round your answer to four decimal places.) Calculate the test statistic and determine the P-value. (Round your test statistic to one decimal place and your P-value to three decimal places.) State the conclusion in the problem context. O Fail to reject Ho. A positive correlation exists between maximum lactate level and muscular endurance. Reject Ho. A positive correlation exists between maximum lactate level and muscular endurance. O Fail to reject Ho. A positive correlation does not exist between maximum lactate level and muscular endurance. O Reject Ho. A…arrow_forwardThe data below is 12 observations of Math SAT scores (x) and scores on Math placement test (y). Calculate the linear correlation coefficient, rr. Enter your answers to two decimal places. X Y 420 426 410 360 600 575 460 538 550 553 480 407 560 635 450 388 400 383 430 402 470 462 440 437 rr =arrow_forwardWhich of the following correlation coefficients indicate the strongest relationship between two variables? A .20 B .87 C .80 D -.95arrow_forward
- MATLAB: An Introduction with ApplicationsStatisticsISBN:9781119256830Author:Amos GilatPublisher:John Wiley & Sons Inc
 Probability and Statistics for Engineering and th...StatisticsISBN:9781305251809Author:Jay L. DevorePublisher:Cengage Learning
 Statistics for The Behavioral Sciences (MindTap C...StatisticsISBN:9781305504912Author:Frederick J Gravetter, Larry B. WallnauPublisher:Cengage Learning
  Elementary Statistics: Picturing the World (7th E...StatisticsISBN:9780134683416Author:Ron Larson, Betsy FarberPublisher:PEARSON
 The Basic Practice of StatisticsStatisticsISBN:9781319042578Author:David S. Moore, William I. Notz, Michael A. FlignerPublisher:W. H. Freeman
 Introduction to the Practice of StatisticsStatisticsISBN:9781319013387Author:David S. Moore, George P. McCabe, Bruce A. CraigPublisher:W. H. Freeman