
MATLAB: An Introduction with Applications
6th Edition
ISBN: 9781119256830
Author: Amos Gilat
Publisher: John Wiley & Sons Inc
expand_more
expand_more
format_list_bulleted
Related questions
Concept explainers
Topic Video
Question
Number 5
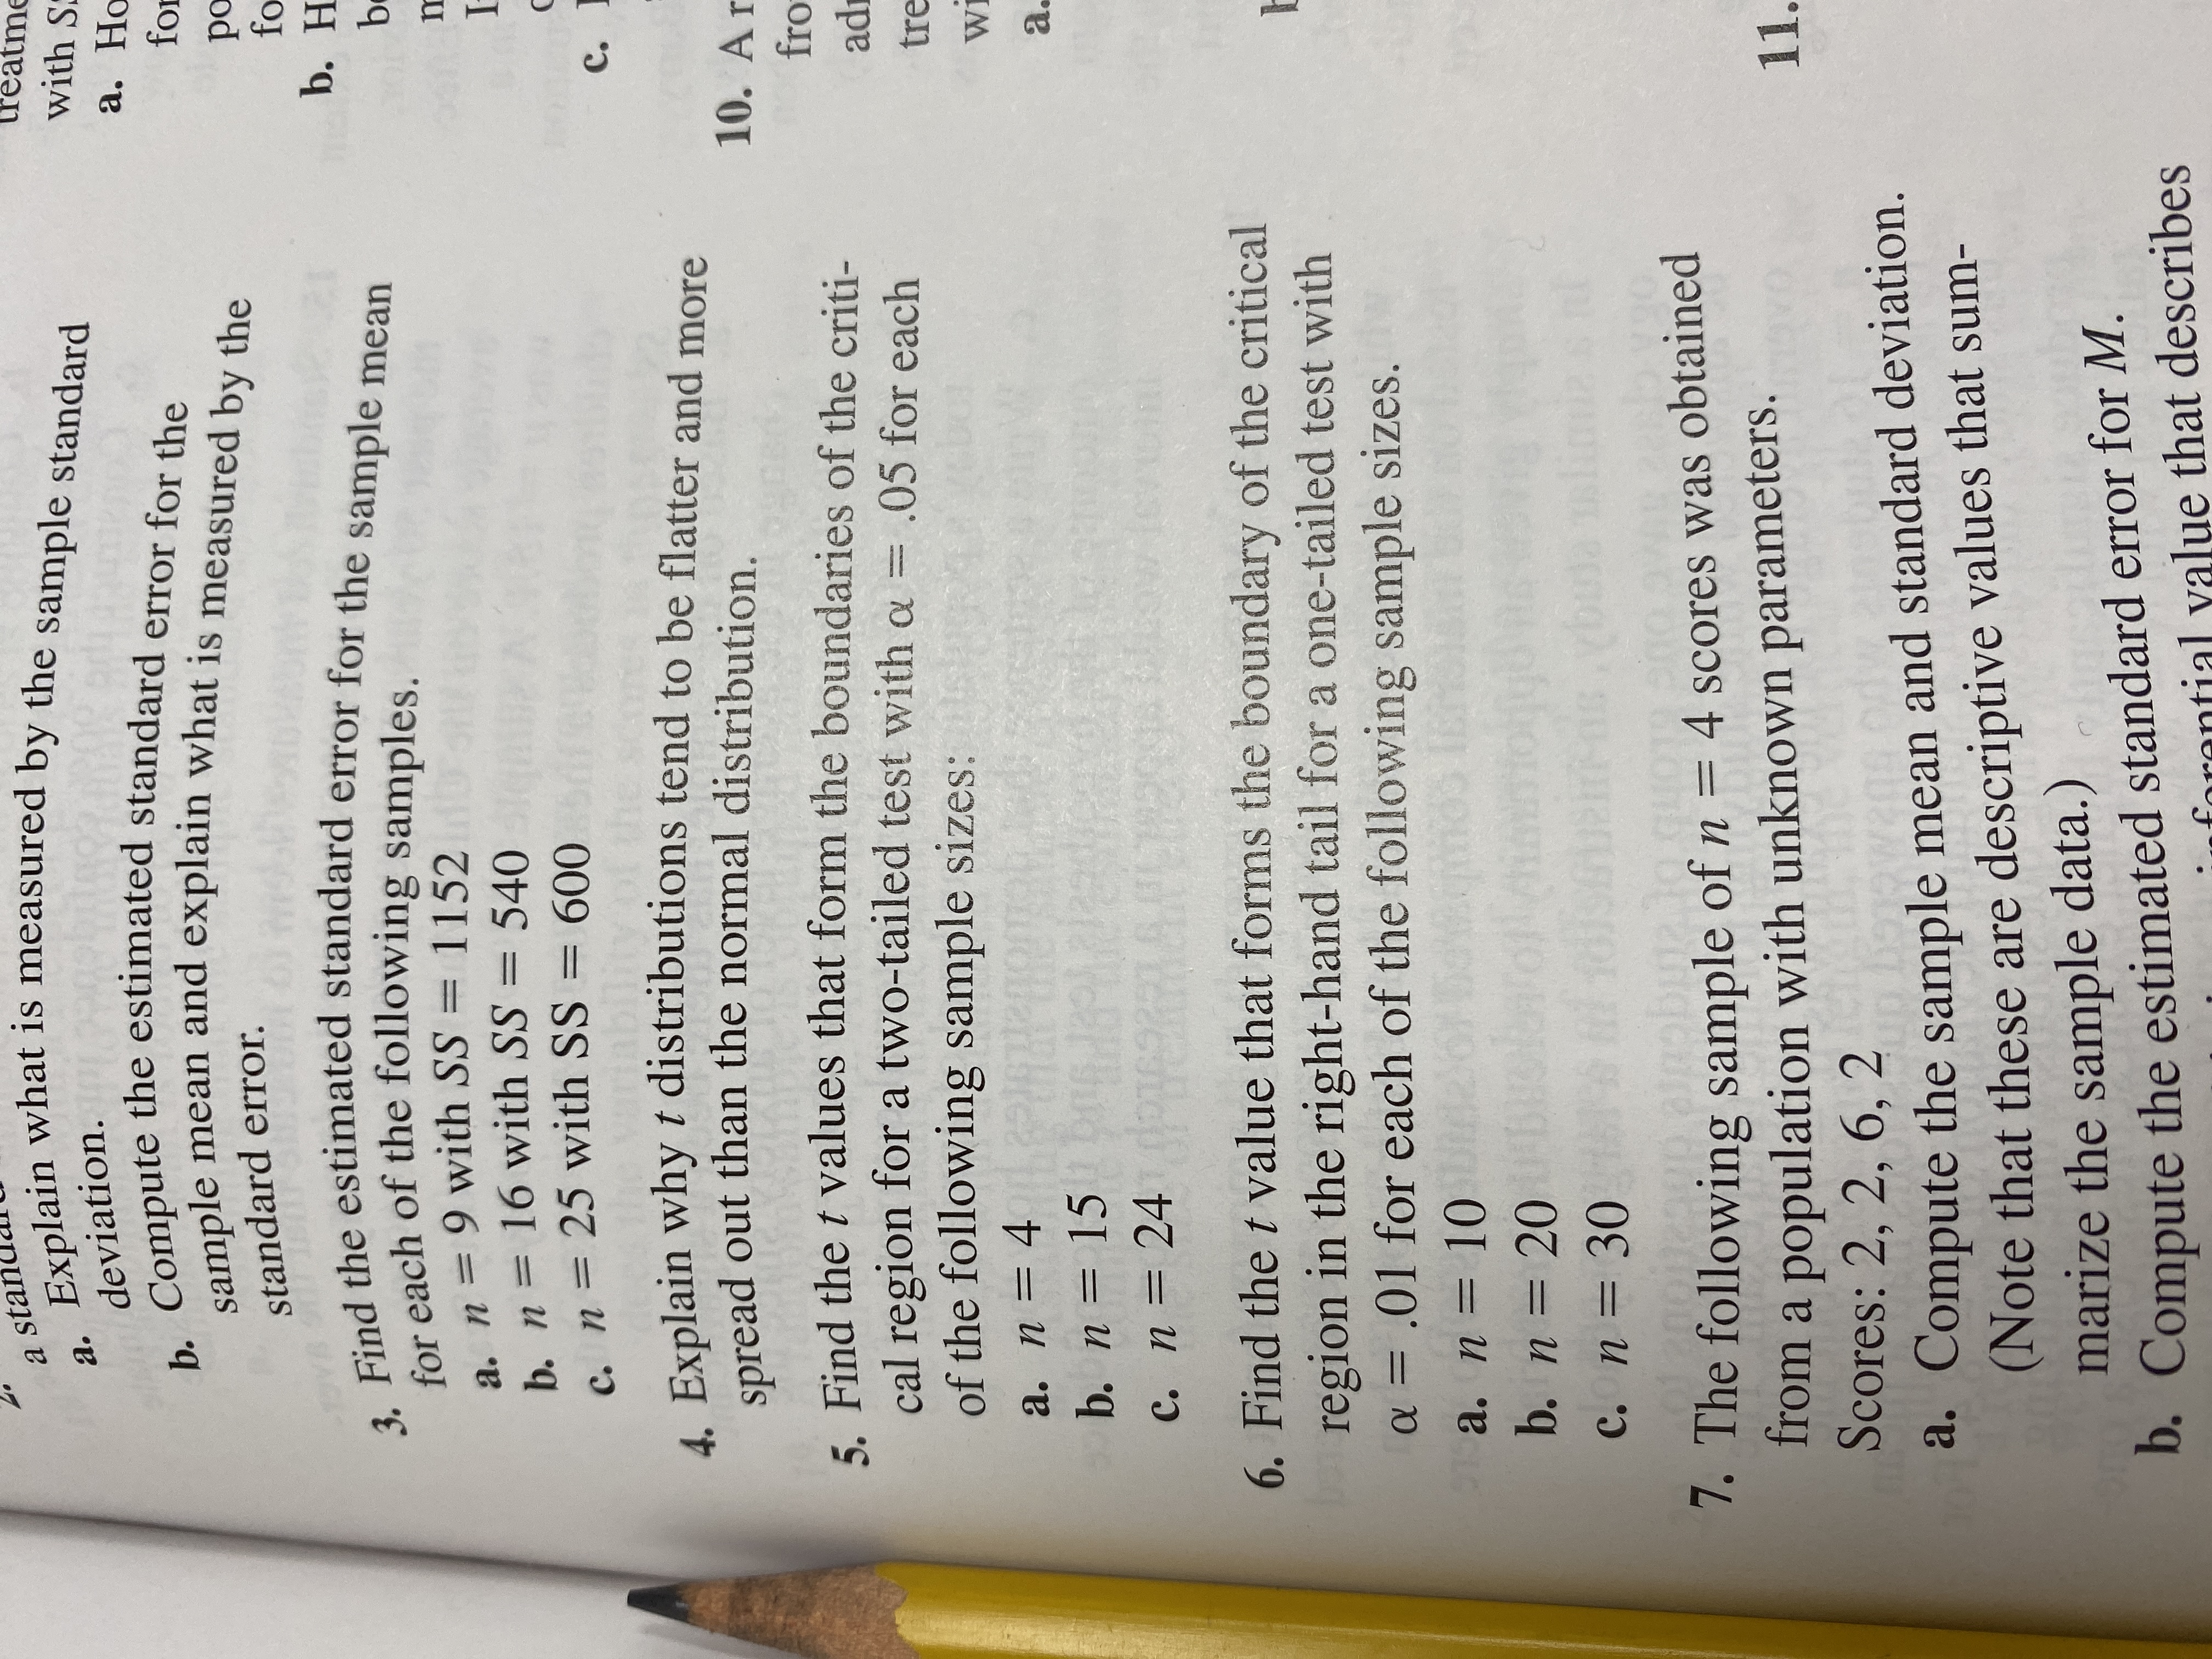

Transcribed Image Text:Explain what is measured by the sample standard
a sta
with S
а.
deviation.
b. Compute the estimated standard error for the
sample mean and explain what is measured by the
а. Но
for
ро
fo
b. H
standard error
3. Find the estimated standard error for the sample mean
for each of the following samples.
a. n 9 with SS = 1152
b. n= 16 with SS=
c. n = 25 with SS = 600
b
540
с.
4. Explain why t distributions tend to be flatter and more
spread out than the normal distribution.
10. Ar
5 Find the t values that form the boundaries of the criti-
cal region for a two-tailed test with a = .05 for each
of the following sample sizes:
= 4 0R
b. n = 15 0
fro
ad
tre
Wi
а. п —
a.
DIC9R
с. п %3D 24
6. Find the t value that forms the boundary of the critical
region in the right-hand tail for a one-tailed test with
a = .01 for each of the following sample sizes.
TE
a. п 3D 10
b. n 20
c. n 30
1. The following sample of n = 4 scores was obtained
from a population with unknown parameters.
Scores: 2, 2, 6, 2
11.
a. Compute the sample mean and standard deviation.
(Note that these are descriptive values that sum-
marize the sample data.)
D. Compute the estimated standard error for M.
forantial value that describes
Expert Solution
This question has been solved!
Explore an expertly crafted, step-by-step solution for a thorough understanding of key concepts.

This is a popular solution

Trending nowThis is a popular solution!

Step by stepSolved in 3 steps with 3 images

Knowledge Booster


Learn more about
Need a deep-dive on the concept behind this application? Look no further. Learn more about this topic, statistics and related others by exploring similar questions and additional content below.Similar questions
arrow_back_ios
arrow_forward_ios
Recommended textbooks for you
- MATLAB: An Introduction with ApplicationsStatisticsISBN:9781119256830Author:Amos GilatPublisher:John Wiley & Sons Inc
 Probability and Statistics for Engineering and th...StatisticsISBN:9781305251809Author:Jay L. DevorePublisher:Cengage Learning
 Statistics for The Behavioral Sciences (MindTap C...StatisticsISBN:9781305504912Author:Frederick J Gravetter, Larry B. WallnauPublisher:Cengage Learning
  Elementary Statistics: Picturing the World (7th E...StatisticsISBN:9780134683416Author:Ron Larson, Betsy FarberPublisher:PEARSON
 The Basic Practice of StatisticsStatisticsISBN:9781319042578Author:David S. Moore, William I. Notz, Michael A. FlignerPublisher:W. H. Freeman
 Introduction to the Practice of StatisticsStatisticsISBN:9781319013387Author:David S. Moore, George P. McCabe, Bruce A. CraigPublisher:W. H. Freeman
MATLAB: An Introduction with Applications
Statistics
ISBN:9781119256830
Author:Amos Gilat
Publisher:John Wiley & Sons Inc
Probability and Statistics for Engineering and th...
Statistics
ISBN:9781305251809
Author:Jay L. Devore
Publisher:Cengage Learning
Statistics for The Behavioral Sciences (MindTap C...
Statistics
ISBN:9781305504912
Author:Frederick J Gravetter, Larry B. Wallnau
Publisher:Cengage Learning
Elementary Statistics: Picturing the World (7th E...
Statistics
ISBN:9780134683416
Author:Ron Larson, Betsy Farber
Publisher:PEARSON
The Basic Practice of Statistics
Statistics
ISBN:9781319042578
Author:David S. Moore, William I. Notz, Michael A. Fligner
Publisher:W. H. Freeman
Introduction to the Practice of Statistics
Statistics
ISBN:9781319013387
Author:David S. Moore, George P. McCabe, Bruce A. Craig
Publisher:W. H. Freeman