
MATLAB: An Introduction with Applications
6th Edition
ISBN: 9781119256830
Author: Amos Gilat
Publisher: John Wiley & Sons Inc
expand_more
expand_more
format_list_bulleted
Related questions
Question
thumb_up100%
Can someone help me to solve all these questions with the data provided using MiniTab? Please and Thank you!!!
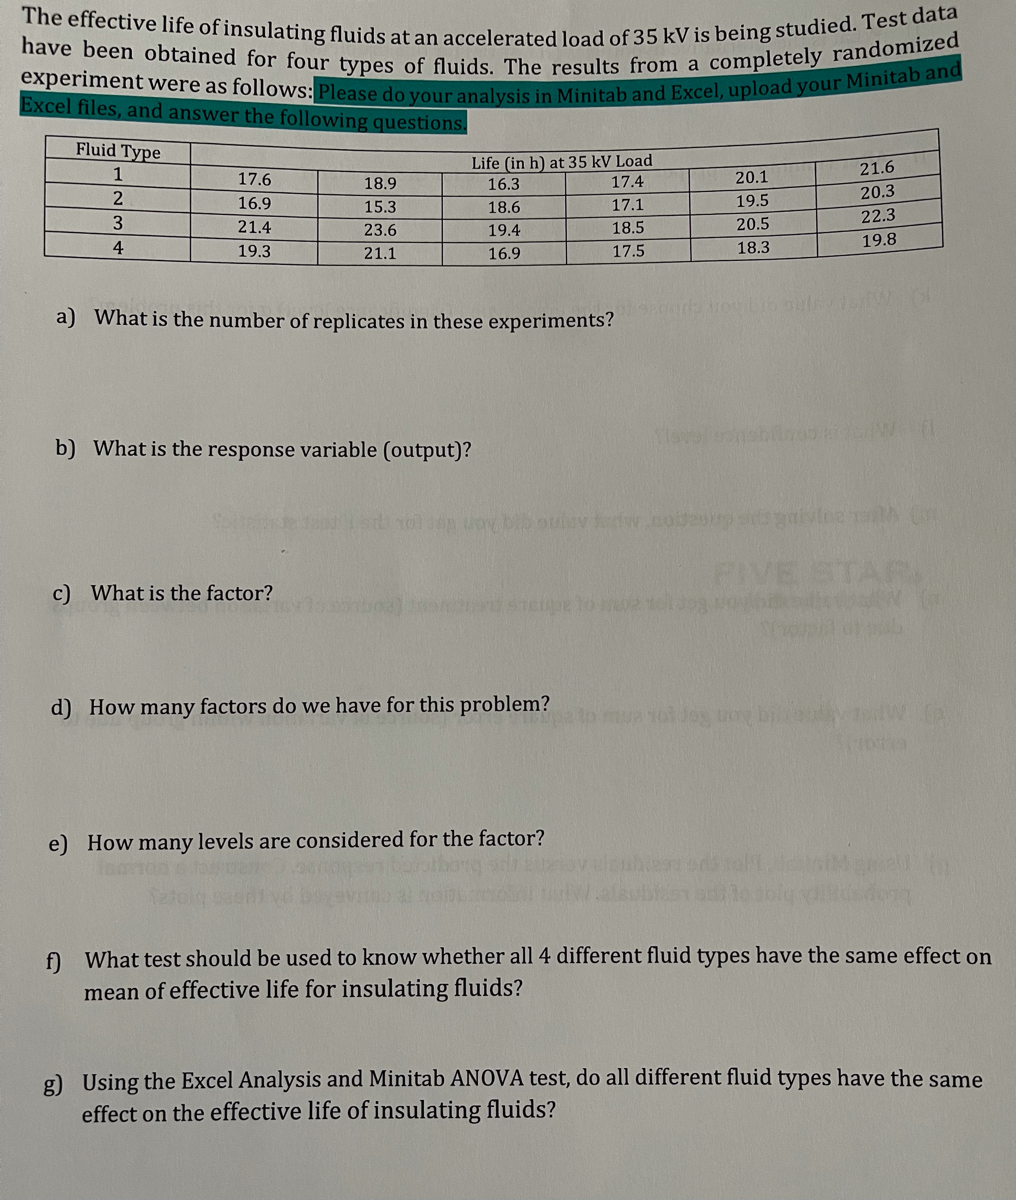

Transcribed Image Text:The effective life of insulating fluids at an accelerated load of 35 kV is being studied. Test data have been obtained for four types of fluids. The results from a completely randomized experiment were as follows: Please do your analysis in Minitab and Excel, upload your Minitab and Excel files, and answer the following questions.
| Fluid Type | Life (in h) at 35 kV Load |
|------------|-----------------------------------|
| 1 | 17.6, 18.9, 16.3, 17.4, 20.1, 21.6|
| 2 | 16.9, 15.3, 18.6, 17.1, 19.5, 20.3|
| 3 | 21.4, 23.6, 19.4, 18.5, 20.5, 22.3|
| 4 | 19.3, 21.1, 16.9, 17.5, 18.3, 19.8|
a) What is the number of replicates in these experiments?
b) What is the response variable (output)?
c) What is the factor?
d) How many factors do we have for this problem?
e) How many levels are considered for the factor?
f) What test should be used to know whether all 4 different fluid types have the same effect on mean of effective life for insulating fluids?
g) Using the Excel Analysis and Minitab ANOVA test, do all different fluid types have the same effect on the effective life of insulating fluids?

Transcribed Image Text:### Educational Website Transcription:
#### Statistical Analysis Questions
h) **What is the null hypothesis (H0) for this problem?**
i) **What is the alternative hypothesis (H1 or HA) for this problem?**
j) **After running the proper test, what is the P-value for this problem?**
k) **What value did you choose for the error type I (significance level) α for this problem?**
l) **What is confidence level?**
m) **After solving the question, what value did you get for the F test statistic?**
n) **What value did you get for sum of square treatment (source of variation between groups due to factor)?**
o) **What value did you get for sum of square error (source of variation within group due to error)?**
p) **Using Minitab, Plot the residuals versus the predicted response. Construct a normal probability plot of the residuals. What information is conveyed by these plots?**
---
*Note: There are no graphs or diagrams included in the image. The content focuses on questions related to hypothesis testing and statistical analysis.*
Expert Solution
This question has been solved!
Explore an expertly crafted, step-by-step solution for a thorough understanding of key concepts.

This is a popular solution

Trending nowThis is a popular solution!

Step by stepSolved in 4 steps

Knowledge Booster

Similar questions
- During the test, the smallest 'volume per breath' is 0.7 liters, and this first happens for a breath that starts 2 seconds into the test. The largest volume per breath is 1.7 liters; this happens for a breath beginning 53 seconds into the test. By creating a math model for this patient's breathing, doctors would have more information to decide if abnormal breathing is happening for the patient during the test**. Note: Let's assume that the patient's breath is steady: that the largest breath is equidistant from the first small breath and the second small breath. a) Find a formula for the function b(t) whose graph models the test data for this patient. b(t) b) If the patient begins a breath every 5 seconds, what are the breath volumes during the first 30 seconds of the test? Hint: Your answer should be a list of numbers. Use the model from part (a) to find your answer(s), and write answers to 2 decimal places. liters **and also, more information to decide if the patient's breathing is…arrow_forwardAre you 100% sure about the answer?Also, can you rewrite it in neat handwriting please!arrow_forwardNot sure why my answer of undefined is incorrect.arrow_forward
- Can you help me with Practice Problem, Thank you.arrow_forwardCan you help me with Practice Problem, Thank you.arrow_forwardYou are driving on a toll highway from King Road to Queen Road (a 50 km drive) in 25 minutes .Two weeks later, you get a speeding ticket in the mail. How can the ticket be justified? Please use mean value theorem to solve.arrow_forward
arrow_back_ios
arrow_forward_ios
Recommended textbooks for you
- MATLAB: An Introduction with ApplicationsStatisticsISBN:9781119256830Author:Amos GilatPublisher:John Wiley & Sons Inc
 Probability and Statistics for Engineering and th...StatisticsISBN:9781305251809Author:Jay L. DevorePublisher:Cengage Learning
 Statistics for The Behavioral Sciences (MindTap C...StatisticsISBN:9781305504912Author:Frederick J Gravetter, Larry B. WallnauPublisher:Cengage Learning
  Elementary Statistics: Picturing the World (7th E...StatisticsISBN:9780134683416Author:Ron Larson, Betsy FarberPublisher:PEARSON
 The Basic Practice of StatisticsStatisticsISBN:9781319042578Author:David S. Moore, William I. Notz, Michael A. FlignerPublisher:W. H. Freeman
 Introduction to the Practice of StatisticsStatisticsISBN:9781319013387Author:David S. Moore, George P. McCabe, Bruce A. CraigPublisher:W. H. Freeman
MATLAB: An Introduction with Applications
Statistics
ISBN:9781119256830
Author:Amos Gilat
Publisher:John Wiley & Sons Inc
Probability and Statistics for Engineering and th...
Statistics
ISBN:9781305251809
Author:Jay L. Devore
Publisher:Cengage Learning
Statistics for The Behavioral Sciences (MindTap C...
Statistics
ISBN:9781305504912
Author:Frederick J Gravetter, Larry B. Wallnau
Publisher:Cengage Learning
Elementary Statistics: Picturing the World (7th E...
Statistics
ISBN:9780134683416
Author:Ron Larson, Betsy Farber
Publisher:PEARSON
The Basic Practice of Statistics
Statistics
ISBN:9781319042578
Author:David S. Moore, William I. Notz, Michael A. Fligner
Publisher:W. H. Freeman
Introduction to the Practice of Statistics
Statistics
ISBN:9781319013387
Author:David S. Moore, George P. McCabe, Bruce A. Craig
Publisher:W. H. Freeman