MATLAB: An Introduction with Applications
6th Edition
ISBN: 9781119256830
Author: Amos Gilat
Publisher: John Wiley & Sons Inc
expand_more
expand_more
format_list_bulleted
Question
Answers:
3a) Z = -1.374, do not reject Ho: no evidence that the means differ significantly from each other
b) 81,
c) t = .72, do not reject Ho: no evidence that the experimental mean is significantly higher than the control mean

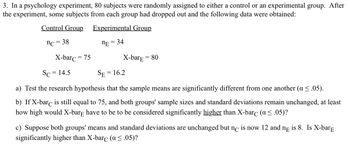
Transcribed Image Text:3. In a psychology experiment, 80 subjects were randomly assigned to either a control or an experimental group. After
the experiment, some subjects from each group had dropped out and the following data were obtained:
Control Group
Experimental Group
nc = 38
nE = 34
X-barc = 75
Sc = 14.5
SE=
=
X-barE = 80
16.2
a) Test the research hypothesis that the sample means are significantly different from one another (a ≤ .05).
b) If X-barc is still equal to 75, and both groups' sample sizes and standard deviations remain unchanged, at least
how high would X-bare have to be to be considered significantly higher than X-barc (a ≤.05)?
c) Suppose both groups' means and standard deviations are unchanged but nc is now 12 and ne is 8. Is X-barE
significantly higher than X-barċ (a ≤.05)?
Expert Solution
This question has been solved!
Explore an expertly crafted, step-by-step solution for a thorough understanding of key concepts.
This is a popular solution
Trending nowThis is a popular solution!
Step by stepSolved in 5 steps with 4 images

Knowledge Booster
Similar questions
- Can you assist me in answering this? (this is not graded but, rather, an excersice conducive to acquisition).arrow_forwardVI. ASSESSMENT/ACTIVITY Compute the z-value and state whether the z-score locates the raw score x within a sample or within a population 1. x = 50 S = 5 X = 40 2. x = 40 o = 8 u = 52 3. x = 36 S = 6 x = 18 4. x = 74 5. x = 82 S = 10 X = 60 o = 15 u = 75arrow_forwardWhat is the value of the test statistic? Find the p-value What is the appropriate conclusion at α=0.10? do not round pleasearrow_forward
- This Quiz: 13 pts possibl Use the Empirical Rule. The mean speed of a sample of vehicles along a stretch of highway is 63 miles per hour, with a standard deviation of 3 miles per hour. Estimate the percent of vehicles whose speeds are between 54 miles per hour and 72 miles per hour. (Assume the data set has a bell-shaped distribution.) Approximately % of vehicles travel between 54 miles per hour and 72 miles per hour. (1,1) More Enter your answer in the answer box.arrow_forwardA sample of 33 lights in Austin gives an average of 46 cars/min while the city SD=3.4 A sample of 34 Dallas lights give a mean of 44 cars/mim with the city SD=1.4 At the 91% level, do the towns differ? 1. Is the test (A-Left Tailed, B-Right Tailed, C-2-Tailed) (separate with comma if there are 2) 2. Critical Value 3. Test statistic 4. 3-decimal p-Valuearrow_forwardhelp me find test statistics, critical values and rejection regionarrow_forward
- For each of the following hypotheses in Questions 6-8, (i) provide the p-value (or its bounds) and (ii) draw a basic conclusion (REJECT or DO NOT REJECT only) with respect to Ho with 99% confidence. Handwritten notes are not necessary for these questions.arrow_forwardAn independent measures study with n = 6 in each sample produces a sample mean difference of 8 points and Sm1-m2= 2. What is the value for the T statistic? A. 1 B. 2 C. 4 D. 4/-8arrow_forwardPlease explain how the bolded option is the correct answerarrow_forward
- Due in Testing: Ho: u = 40.26 H1: u # 40.26 Your sample consists of 29 subjects, with a mean of 42.1 and a sample standard deviation (s) of 4.48. Calculate the test statistic, rounded to 2 decimal płaces.arrow_forwardCan you answer whats blank?arrow_forwardPlease answer the incorrect ones only.arrow_forward
arrow_back_ios
SEE MORE QUESTIONS
arrow_forward_ios
Recommended textbooks for you
 MATLAB: An Introduction with ApplicationsStatisticsISBN:9781119256830Author:Amos GilatPublisher:John Wiley & Sons Inc
 Probability and Statistics for Engineering and th...StatisticsISBN:9781305251809Author:Jay L. DevorePublisher:Cengage Learning
 Statistics for The Behavioral Sciences (MindTap C...StatisticsISBN:9781305504912Author:Frederick J Gravetter, Larry B. WallnauPublisher:Cengage Learning
 Elementary Statistics: Picturing the World (7th E...StatisticsISBN:9780134683416Author:Ron Larson, Betsy FarberPublisher:PEARSON
 The Basic Practice of StatisticsStatisticsISBN:9781319042578Author:David S. Moore, William I. Notz, Michael A. FlignerPublisher:W. H. Freeman
 Introduction to the Practice of StatisticsStatisticsISBN:9781319013387Author:David S. Moore, George P. McCabe, Bruce A. CraigPublisher:W. H. Freeman

MATLAB: An Introduction with Applications
Statistics
ISBN:9781119256830
Author:Amos Gilat
Publisher:John Wiley & Sons Inc

Probability and Statistics for Engineering and th...
Statistics
ISBN:9781305251809
Author:Jay L. Devore
Publisher:Cengage Learning

Statistics for The Behavioral Sciences (MindTap C...
Statistics
ISBN:9781305504912
Author:Frederick J Gravetter, Larry B. Wallnau
Publisher:Cengage Learning

Elementary Statistics: Picturing the World (7th E...
Statistics
ISBN:9780134683416
Author:Ron Larson, Betsy Farber
Publisher:PEARSON

The Basic Practice of Statistics
Statistics
ISBN:9781319042578
Author:David S. Moore, William I. Notz, Michael A. Fligner
Publisher:W. H. Freeman

Introduction to the Practice of Statistics
Statistics
ISBN:9781319013387
Author:David S. Moore, George P. McCabe, Bruce A. Craig
Publisher:W. H. Freeman