
MATLAB: An Introduction with Applications
6th Edition
ISBN: 9781119256830
Author: Amos Gilat
Publisher: John Wiley & Sons Inc
expand_more
expand_more
format_list_bulleted
Related questions
Question

Transcribed Image Text:## EXPERIMENT 1
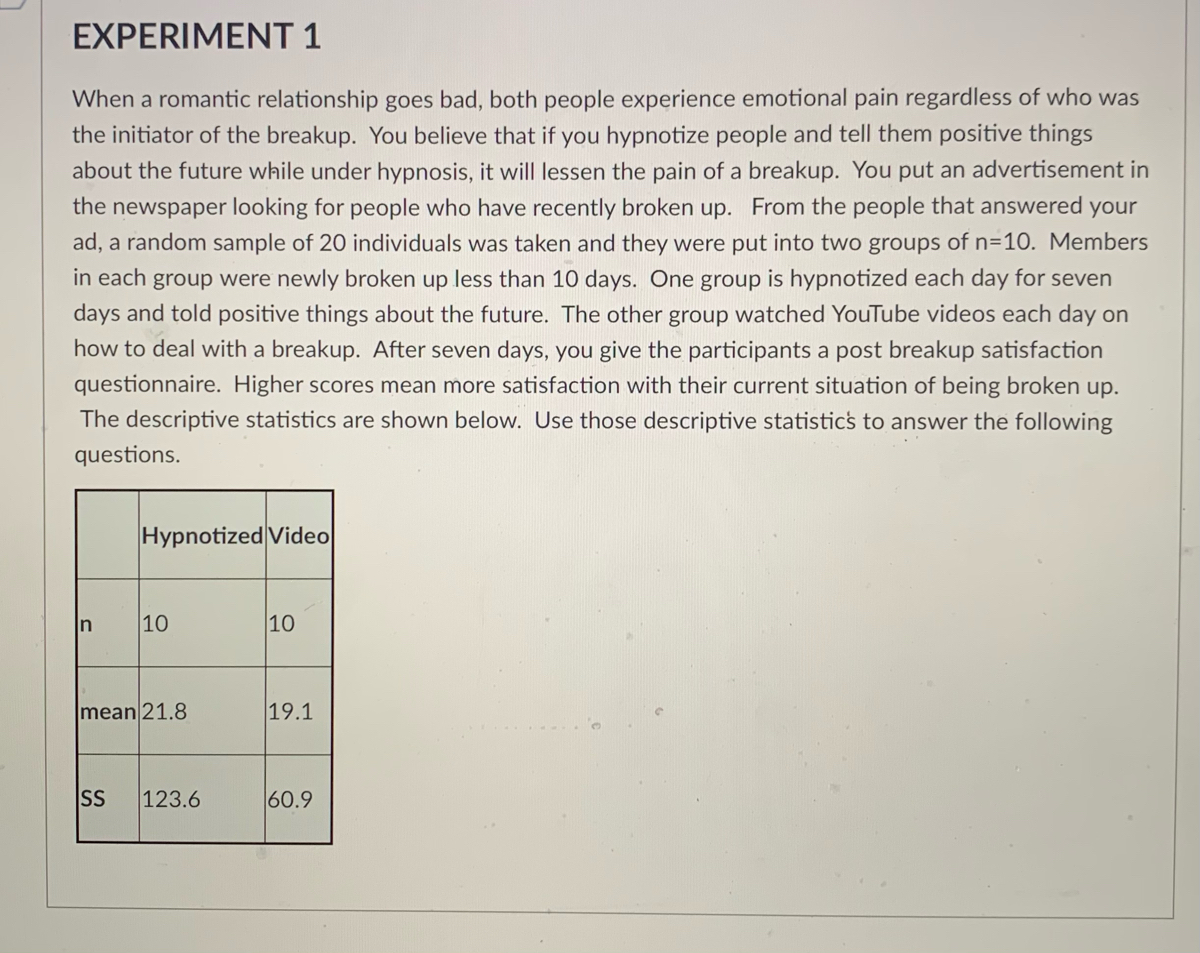
When a romantic relationship goes bad, both people experience emotional pain regardless of who was the initiator of the breakup. You believe that if you hypnotize people and tell them positive things about the future while under hypnosis, it will lessen the pain of a breakup. You put an advertisement in the newspaper looking for people who have recently broken up. From the people that answered your ad, a random sample of 20 individuals was taken and they were put into two groups of n=10. Members in each group were newly broken up less than 10 days. One group is hypnotized each day for seven days and told positive things about the future. The other group watched YouTube videos each day on how to deal with a breakup. After seven days, you give the participants a post-breakup satisfaction questionnaire. Higher scores mean more satisfaction with their current situation of being broken up. The descriptive statistics are shown below. Use those descriptive statistics to answer the following questions.
| | Hypnotized | Video |
|-----------------|------------|-------|
| **n** | 10 | 10 |
| **mean** | 21.8 | 19.1 |
| **SS** | 123.6 | 60.9 |
The table summarizes the data for the two groups:
- **n**: Number of participants in each group.
- **mean**: Mean satisfaction score for each group.
- **SS**: Sum of squares, a measure of variability within each group.
![### Experiment Analysis
#### Question:
What is the \( t_{obs} \) in **EXPERIMENT 1**? (round to two decimals)
#### Answer Input:
[__________]
---
In this educational exercise, students are prompted to identify and calculate \( t_{obs} \) for a given experimental context, in this case, **EXPERIMENT 1**. The students are instructed to round their answer to two decimal places and enter it into the provided input field.
- **Explanation of \( t_{obs} \)**:
- The symbol \( t_{obs} \) typically denotes the observed value of the t-statistic from a t-test. This is a standard statistical method used to determine if there is a significant difference between the means of two groups.
- **Rounding Instructions**:
- Ensure that the calculated \( t_{obs} \) is accurate to two decimal places before submission.
This question tests the student's understanding of statistical analysis and their ability to apply rounding rules to produce accurate and meaningful scientific results.](https://content.bartleby.com/qna-images/question/e5f49087-22ae-4ef1-b91b-6905f9f28b09/a8422b6b-b335-40a9-8b7e-85d34a395283/fna7hea_processed.jpeg)
Transcribed Image Text:### Experiment Analysis
#### Question:
What is the \( t_{obs} \) in **EXPERIMENT 1**? (round to two decimals)
#### Answer Input:
[__________]
---
In this educational exercise, students are prompted to identify and calculate \( t_{obs} \) for a given experimental context, in this case, **EXPERIMENT 1**. The students are instructed to round their answer to two decimal places and enter it into the provided input field.
- **Explanation of \( t_{obs} \)**:
- The symbol \( t_{obs} \) typically denotes the observed value of the t-statistic from a t-test. This is a standard statistical method used to determine if there is a significant difference between the means of two groups.
- **Rounding Instructions**:
- Ensure that the calculated \( t_{obs} \) is accurate to two decimal places before submission.
This question tests the student's understanding of statistical analysis and their ability to apply rounding rules to produce accurate and meaningful scientific results.
Expert Solution
This question has been solved!
Explore an expertly crafted, step-by-step solution for a thorough understanding of key concepts.

This is a popular solution

Trending nowThis is a popular solution!

Step by stepSolved in 2 steps with 2 images

Knowledge Booster


Learn more about
Need a deep-dive on the concept behind this application? Look no further. Learn more about this topic, statistics and related others by exploring similar questions and additional content below.Similar questions
- In a survey of working parents (both parents working), one of the questions asked was "Have you refused a job, promotion, or transfer because it would mean less time with your family?" Two hundred men and 200 women were asked this question. Twenty-nine percent of the men and 24% of the women responded "yes." a. Based on this survey, can we conclude that there is a difference in the proportion of man and women responding “yes" at the 0.05 level of significance? (i) State the null and alternative hypotheses (ii) What test statistics would you use and why? (iii) Compute the value of the test-statistic. (iv) What rejection region would you use? (v) State your conclusion in the context of the problem. b. What P-value is associated with this test? Based on this P-value, could H. be rejected at significance level 0.08? c. Find a 95% confidence interval for the difference between the proportion of men and women responding "yes." Based on this confidence interval, would your conclusion be the…arrow_forwardYour statistics instructor claims that 60 percent of the students who take her Elementary Statistics class go through life feeling more enriched. For some reason that she can't quite figure out, most people don't believe her. You decide to check this out on your own. You randomly survey 55 of her past Elementary Statistics students and find that 29 feel more enriched as a result of her class. Now, what do you think?arrow_forwardIn a survey of families in which both parents work, one of the questions asked was, “Have you refused a job, promotion, or transfer because it would mean less time with your family?” A total of 200 men and 200 women were asked this question. “Yes” was the response given by 29% of the men and 24% of the women. Based on this survey, can we conclude that there is a difference in the proportion of men and women responding “yes” at the 0.05 level of significance?arrow_forward
- You are a sales manager for a grocery store, and you want to see if the introduction of a new sales promotion will increase the sales in your store. To do so, you decided to create an experiment by giving a small sample of customers the promotion before expanding it to a larger customer base. You gave 18 people the promotion, and also observed the sales of 27 people who did not get the promotion as a control group. You found those who received the promotion to have an average monthly sales of $456.60, with a sample standard deviation of $52.23. You found those who did not receive the promotion had an average monthly sales of $361.46, with a sample standard deviation of $56.11. Suppose you want to use hypothesis testing (two-sample test) to investigate if the promotion has increased the sales of your store. Using the order promotion no promotion in your hypothesis test, what is the value of the test statistic for your analysis? Note: 1- Only round your final answer. Round your final…arrow_forwardSuppose you were presented with the results of a study comparing two different training methods for basketball athletes. You are told 32 athletes were randomly assigned to the two groups so that 16 were in the group A and 16 were in the group B. At the end of the session, the average scores (wins versus losses) of the two groups/teams were compared and a difference of 10% was observed ( the first team had 10% more wins than the second). The coach observer reports two- sample t-test shows this difference is statistically significant. How would you interpret these findings? What questions or concerns would you have? How might this type of study be improved? Hint: Consider the possibility that the test performed was not the appropriate one.arrow_forwardA report describes a survey of 251 adult Americans. Participants in the survey were asked how often they disinfect their phone and were asked to respond with one of the following categories: more than once a week, once a week, every other, week, every three weeks, or less often than every three weeks. For this group, 9% responded more than once a week, 52% responded once a week, 26% responded every other week, 6% responded every three weeks, and 7% responded less often than every three weeks. Fill in the table below with the relative frequency distributions. How Often? Relative Frequency More than once a week Once a week Every other week Every three weeks Less often than every three weeksarrow_forward
- On a particular night, a baseball stadium sells 60% of its seats, and of those, 15% do not end up showing up to the game. Assuming everyone present is sitting in a seat, what percentage of seats in the stadium are empty?arrow_forwardAs a destination marketing director, you found that TV executives used the guideline that 25% of the viewers were watching Fox cable network, 22% watching NBC and CBS, and 19% watching ABC. The remaining 12% were watching other cable networks such as CNN and MSNBC on a weekday night. A random sample of 500 viewers in the D.C. metro area last Tuesday night showed 109 homes were tuned in to the Fox station, 125 homes tuning in to NBC affiliate, 100 homes tuning in to CBS affiliate and 81 homes tuning in to ABC affiliate. 85 homes were watching CNN and NSNBC cable stations. At the 0.05 significant level, can we conclude that the guideline is still reasonable?arrow_forwardThe statistics department at a large Midwestern university is interested in how students feel about their introductory statistics course. They decide to randomly select 60 introductory stats students to give a survey, 10 from both the freshman and sophomore class ranks and 20 from both the junior and senior class ranks. They discover that of the 60 total respondents, 73% have a positive attitude toward intro stats. The proportion of the 60 introductory statistics students surveyed by the statistics department that did have positive attitudes toward intro stats (73%) is called a O a. population parameter O b. residual O c. correlation coefficient O d. sample statistic 3 Stat100 Practice..pdf 7 Writing Prompt 3.docx E Online Syllabus J...pdf E Bios357Schedul.pdf SH OCT1 étv 20 F3 トI A FI F9 F10 F5 F7 F8 F2 F4 %23 2$ & * 2 4. 5 6 7 8 9 Q W E T Y S F G H K しのarrow_forward
- A psychologist conducted a survey of the attitude towards the sustainability of American energy consumption with 250250 randomly selected individuals several years ago. The psychologist believes that these attitudes have changed over time. To test this he randomly selects 250250 individuals and asks them the same questions. Can the psychologist confirm his theory that the attitudes have changed from the first survey to the second survey? Attitude 1st Survey 2nd Survey Optimistic 50%50% 52%52% Slightly Optimistic 16%16% 10%10% Slightly Pessimistic 11%11% 15%15% Pessimistic 23%23% 23%23% Copy Data Step 6 of 10 : Find the value of the test statistic. Round your answer to three decimal places. Step 7 of 10: Find the degrees of freedom associated with the test statistic for this problem Step 8 of 10: Find the critical value of the test at the 0.025 level of significance. Round your answer to three decimal places.step 9 of 10: make the decision to reject or fail to reject…arrow_forwardIn a series of studies, Sebastian Deri and his colleagues (2017) asked multiple groups about the number of friend groups they had and how often they attended different social events. They then asked participants how they thought their own numbers compared to other people's: Did participants see themselves as less social, the same as, or more social than others? In the first study, the researchers reported that: "Three hundred four participants from Amazon's Mechanical Turk (150 women; Mage = 37.1; 78% White, 10% Black, and 6% Asian) completed a survey in exchange for modest payment" (p. 860). What do the researchers mean by "Amazon's Mechanical Turk" with respect to their sample of participants? O A. An archival data set that already exists and from which researchers can use data O B. An online tool that researchers can use to recruit people to participate in research in exchange for a small payment O C. An e-book sold by Amazon that includes contact information for possible…arrow_forwardA doctor wanted to study the effect of four different treatments on mental health. A group of 100 adults experiencing depression volunteered for the study. The doctor randomly assigned one-fourth of them to each of four groups. Group 1 followed a specific exercise plan, group 2 followed a specific diet plan, group 3 followed an exercise and diet plan, and group 4 did not follow any plan. After 4 weeks, the doctor contacted each participant and asked them if they felt any better. The results are displayed in the table. The doctor would like to know if these data provide convincing evidence that the distribution of responses differs across the treatment groups in the population of all patients like these. The random condition is met. The 10% condition is not needed because random sampling did not take place. This table of expected counts shows that all expected counts are at least 5. What is the value of the chi-square test statistic? χ‑2 = 5.03 χ‑2 = 6.26 χ‑2 = 25.33 χ‑2 = 39.22arrow_forward
arrow_back_ios
arrow_forward_ios
Recommended textbooks for you
- MATLAB: An Introduction with ApplicationsStatisticsISBN:9781119256830Author:Amos GilatPublisher:John Wiley & Sons Inc
 Probability and Statistics for Engineering and th...StatisticsISBN:9781305251809Author:Jay L. DevorePublisher:Cengage Learning
 Statistics for The Behavioral Sciences (MindTap C...StatisticsISBN:9781305504912Author:Frederick J Gravetter, Larry B. WallnauPublisher:Cengage Learning
  Elementary Statistics: Picturing the World (7th E...StatisticsISBN:9780134683416Author:Ron Larson, Betsy FarberPublisher:PEARSON
 The Basic Practice of StatisticsStatisticsISBN:9781319042578Author:David S. Moore, William I. Notz, Michael A. FlignerPublisher:W. H. Freeman
 Introduction to the Practice of StatisticsStatisticsISBN:9781319013387Author:David S. Moore, George P. McCabe, Bruce A. CraigPublisher:W. H. Freeman
MATLAB: An Introduction with Applications
Statistics
ISBN:9781119256830
Author:Amos Gilat
Publisher:John Wiley & Sons Inc
Probability and Statistics for Engineering and th...
Statistics
ISBN:9781305251809
Author:Jay L. Devore
Publisher:Cengage Learning
Statistics for The Behavioral Sciences (MindTap C...
Statistics
ISBN:9781305504912
Author:Frederick J Gravetter, Larry B. Wallnau
Publisher:Cengage Learning
Elementary Statistics: Picturing the World (7th E...
Statistics
ISBN:9780134683416
Author:Ron Larson, Betsy Farber
Publisher:PEARSON
The Basic Practice of Statistics
Statistics
ISBN:9781319042578
Author:David S. Moore, William I. Notz, Michael A. Fligner
Publisher:W. H. Freeman
Introduction to the Practice of Statistics
Statistics
ISBN:9781319013387
Author:David S. Moore, George P. McCabe, Bruce A. Craig
Publisher:W. H. Freeman