ENGR.ECONOMIC ANALYSIS
14th Edition
ISBN: 9780190931919
Author: NEWNAN
Publisher: Oxford University Press
expand_more
expand_more
format_list_bulleted
Question

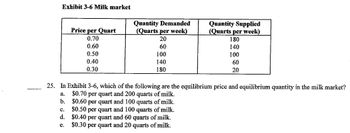
Transcribed Image Text:Exhibit 3-6 Milk market
Price per Quart
Quantity Demanded
(Quarts per week)
Quantity Supplied
(Quarts per week)
0.70
20
180
0.60
60
140
0.50
100
100
0.40
140
60
0.30
180
20
25. In Exhibit 3-6, which of the following are the equilibrium price and equilibrium quantity in the milk market?
a. $0.70 per quart and 200 quarts of milk.
b.
$0.60 per quart and 100 quarts of milk.
c.
$0.50 per quart and 100 quarts of milk.
d. $0.40 per quart and 60 quarts of milk.
$0.30 per quart and 20 quarts of milk.
e.
Expert Solution
This question has been solved!
Explore an expertly crafted, step-by-step solution for a thorough understanding of key concepts.
Step by stepSolved in 2 steps

Knowledge Booster
Similar questions
- 10. Market equilibrium The following table shows the monthly demand and supply in the market for shoes in San Francisco. Price Quantity Demanded Quantity Supplied (Dollars per pair of shoes) (Pairs of shoes) (Pairs of shoes) 20 1,650 300 40 1,200 750 60 600 1,050 80 300 1,350 100 150 1,500 On the following graph, plot the demand for shoes using the blue point (circle symbol). Next, plot the supply of shoes using the orange point (square symbol). Finally, use the black point (plus symbol) to indicate the equilibrium price and quantity in the market for shoes. Note: Plot your points in the order in which you would like them connected. Line segments will connect the points automatically. 120 100 Demand 80 Supply 60 Equilibrium 40 20 300 600 900 1200 1500 1800 QUANTITY (Pairs of shoes) PRICE (Dollars per pair of shoes)arrow_forwardSolve it!arrow_forwardQuestion 4 of 12 Attempt 5 Use the graph to show how an increase in the price of organic onions would shift the demand curve, supply curve, or both curves in the market for tomatoes. Assume that, to consumers, onions and tomatoes are neither complements nor substitutes. Market for Tomatoes 10 Supply 6 4. 3. Demand 10 12 14 16 18 20 Quantity (Ibs) a. 939 PM 64°F 10/13/2021 Price ($)arrow_forward
- 2. For each of the following, state (and support with a graph) how the change will affect supply, demand, quantity supplied, quantity demanded, equilibrium quantity, and equilibrium price in the market for French fries in Laramie. a. The Burger King on Grand Avenue closes for a remodel ). b. UW has the largest incoming freshmen class this year . c. Consumers' income increases and the price of potatoes increases .arrow_forwardQuantity supplied will….arrow_forward3. Suppose the "American Heart Association" announces an abundance of good heart healthy fats of Pecan. At the same time, there is a cut in production due to severe weather condition. Graph this market's initial equilibrium (P1, Q1) as well as its new equilibrium (P2, Q2) in a well labeled graph. Make sure you indicate the direction of any changes in price and quantity.arrow_forward
- Refer to the figure. Price (dollars) 10 9 8 7 5 a 3 2 1 0 Market for Artichokes 50 100 D 150 3 200 Quantity (pounds of artichokes) 250 Tools ES O The graph represents the market for artichokes (in pounds per week) at a Midwest farmers' market Suppose the equilibrium price of artichokes is $3 per pound and the equilibrium quantity is 100 pounds of artichokes per week. Using the graph determine how much economic surplus is generated in the market each week. Economic surplus: $arrow_forwardThe market for pizza has the following demand and supply schedules: Price (Dollars) 4 5 6 7 8 9 Quantity Demanded Quantity Supplied (Pizzas) 135 104 81 68 53 39 (Pizzas) 26 53 81 98 110 121arrow_forward6. Market equilibrium The following table shows the monthly demand and supply in the market for orange juice in Chicago. Price Quantity Demanded Quantity Supplied (Dollars per gallon of orange juice) (Gallons of orange juice) (Gallons of orange juice) 2 500 50 4 400 150 6 300 8 200 10 100 200 300 450 On the following graph, plot the demand for orange juice using the blue point (circle symbol). Next, plot the supply of orange juice using the orange point (square symbol). Finally, use the black point (plus symbol) to indicate the equilibrium price and quantity in the market for orange juice. Note: Plot your points in the order in which you would like them connected. Line segments will connect the points automatically.arrow_forward
arrow_back_ios
arrow_forward_ios
Recommended textbooks for you

 Principles of Economics (12th Edition)EconomicsISBN:9780134078779Author:Karl E. Case, Ray C. Fair, Sharon E. OsterPublisher:PEARSON
 Engineering Economy (17th Edition)EconomicsISBN:9780134870069Author:William G. Sullivan, Elin M. Wicks, C. Patrick KoellingPublisher:PEARSON
 Principles of Economics (MindTap Course List)EconomicsISBN:9781305585126Author:N. Gregory MankiwPublisher:Cengage Learning
 Managerial Economics: A Problem Solving ApproachEconomicsISBN:9781337106665Author:Luke M. Froeb, Brian T. McCann, Michael R. Ward, Mike ShorPublisher:Cengage Learning
 Managerial Economics & Business Strategy (Mcgraw-...EconomicsISBN:9781259290619Author:Michael Baye, Jeff PrincePublisher:McGraw-Hill Education


Principles of Economics (12th Edition)
Economics
ISBN:9780134078779
Author:Karl E. Case, Ray C. Fair, Sharon E. Oster
Publisher:PEARSON

Engineering Economy (17th Edition)
Economics
ISBN:9780134870069
Author:William G. Sullivan, Elin M. Wicks, C. Patrick Koelling
Publisher:PEARSON

Principles of Economics (MindTap Course List)
Economics
ISBN:9781305585126
Author:N. Gregory Mankiw
Publisher:Cengage Learning

Managerial Economics: A Problem Solving Approach
Economics
ISBN:9781337106665
Author:Luke M. Froeb, Brian T. McCann, Michael R. Ward, Mike Shor
Publisher:Cengage Learning

Managerial Economics & Business Strategy (Mcgraw-...
Economics
ISBN:9781259290619
Author:Michael Baye, Jeff Prince
Publisher:McGraw-Hill Education